Supported by Dr. Osamu Ogasawara and  . . |
|
Last data update: 2014.03.03 |
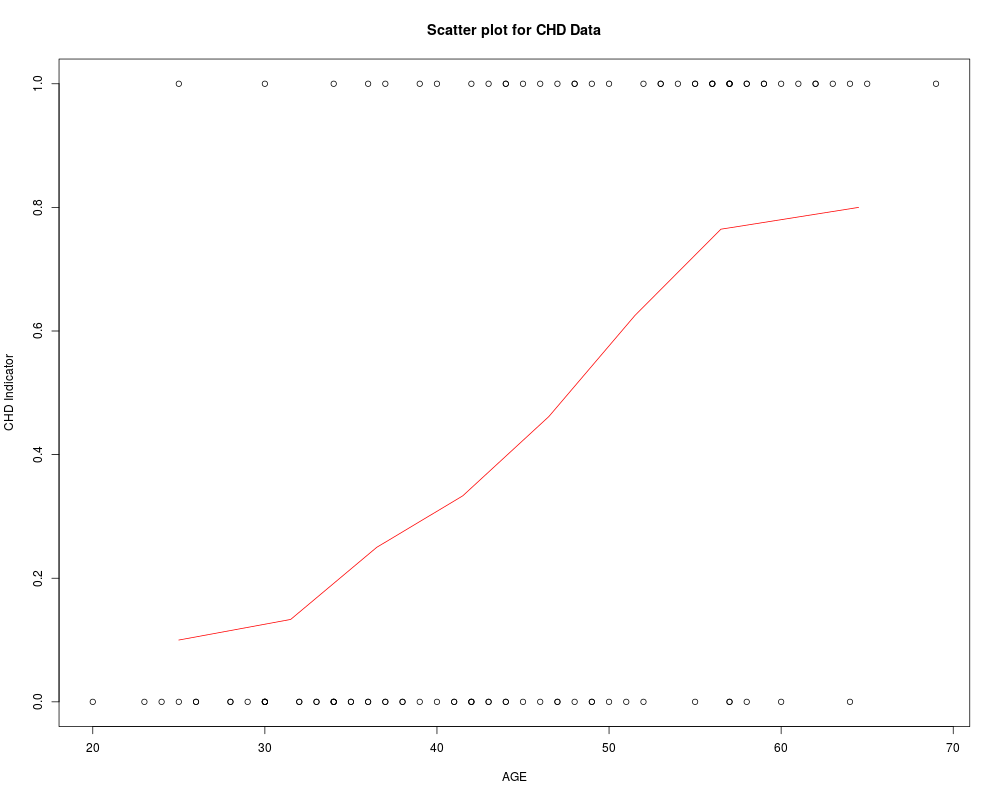
Coronary Heart DiseaseDescriptionA well known explanation of the heart disease is that as the age increases, the risk of coronary heart disease also increase. The current data set and the example may be found in Chapter 1 of Hosmer and Lemeshow (1990-2013). Usagedata(chdage) FormatA data frame with 100 observations on the following 3 variables.
SourceHosmer and Lemeshow (1990-2013). ReferencesHosmer, D.W., and Lemeshow, S. (1990-20013). Applied Logistic Regression, 3e. Wiley. Examplesdata(chdage) plot(chdage$AGE,chdage$CHD,xlab="AGE",ylab="CHD Indicator", main="Scatter plot for CHD Data") agegrp <- cut(chdage$AGE,c(19,29,34,39,44,49,54,59,69),include.lowest=TRUE, labels=c(25,seq(31.5,56.5,5),64.5)) mp <- c(25,seq(31.5,56.5,5),64.5) # mid-points chd_percent <- prop.table(table(agegrp,chdage$CHD),1)[,2] points(mp,chd_percent,"l",col="red") Results
R version 3.3.1 (2016-06-21) -- "Bug in Your Hair"
Copyright (C) 2016 The R Foundation for Statistical Computing
Platform: x86_64-pc-linux-gnu (64-bit)

R is free software and comes with ABSOLUTELY NO WARRANTY.
You are welcome to redistribute it under certain conditions.
Type 'license()' or 'licence()' for distribution details.

R is a collaborative project with many contributors.
Type 'contributors()' for more information and
'citation()' on how to cite R or R packages in publications.

Type 'demo()' for some demos, 'help()' for on-line help, or
'help.start()' for an HTML browser interface to help.
Type 'q()' to quit R.

> library(ACSWR)
> png(filename="/home/ddbj/snapshot/RGM3/R_CC/result/ACSWR/chdage.Rd_%03d_medium.png", width=480, height=480)
> ### Name: chdage
> ### Title: Coronary Heart Disease
> ### Aliases: chdage
> ### Keywords: logistic regression
>
> ### ** Examples
>
> data(chdage)
> plot(chdage$AGE,chdage$CHD,xlab="AGE",ylab="CHD Indicator",
+ main="Scatter plot for CHD Data")
> agegrp <- cut(chdage$AGE,c(19,29,34,39,44,49,54,59,69),include.lowest=TRUE,
+ labels=c(25,seq(31.5,56.5,5),64.5))
> mp <- c(25,seq(31.5,56.5,5),64.5) # mid-points
> chd_percent <- prop.table(table(agegrp,chdage$CHD),1)[,2]
> points(mp,chd_percent,"l",col="red")
>
>
>
>
>
> dev.off()
null device
          1
>
|
Created & Maintained by Osamu Ogasawara (osamu.ogasawara@gmail.com) and 