Supported by Dr. Osamu Ogasawara and  . . |
|
Last data update: 2014.03.03 |
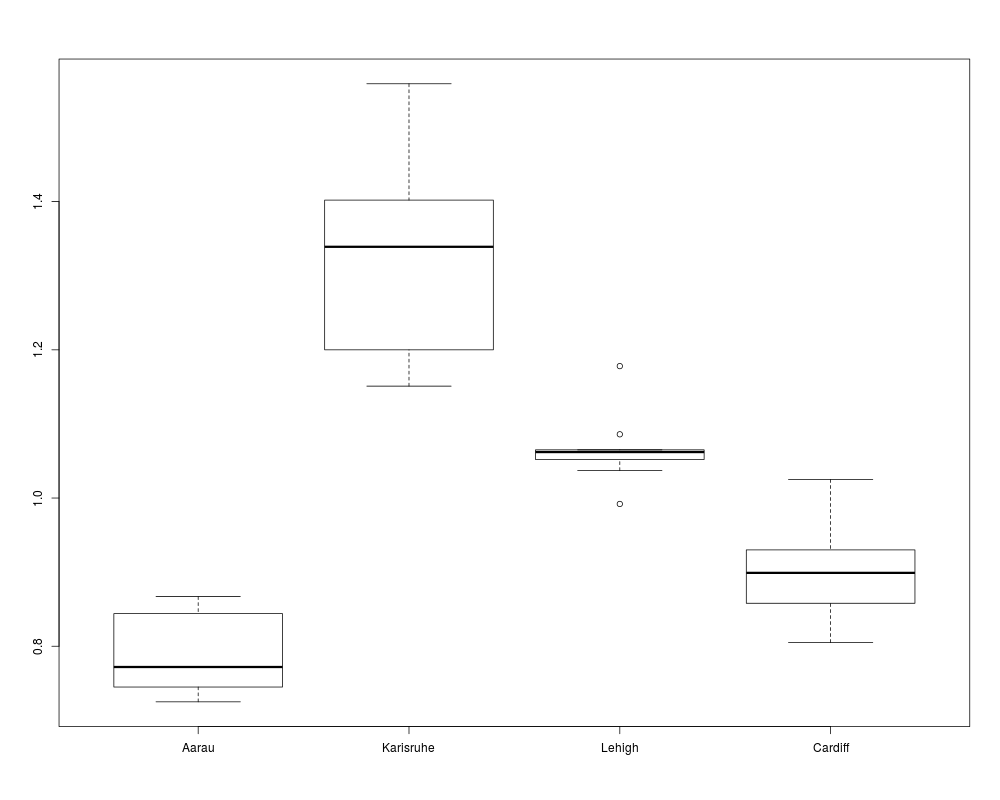
Strength Data Set of a Girder ExperimentDescriptionThe shear strength of steel plate girders need to be modeled as a function of the four methods and nine girders. Usagedata(girder) FormatA data frame with 9 observations on the following 5 variables.
ReferencesWu, C.F.J. and M. Hamada (2000-9). Experiments: Planning, Analysis, and Parameter Design Optimization, 2e. J. Wiley. Examplesdata(girder) girder boxplot(girder[,2:5]) Results
R version 3.3.1 (2016-06-21) -- "Bug in Your Hair"
Copyright (C) 2016 The R Foundation for Statistical Computing
Platform: x86_64-pc-linux-gnu (64-bit)

R is free software and comes with ABSOLUTELY NO WARRANTY.
You are welcome to redistribute it under certain conditions.
Type 'license()' or 'licence()' for distribution details.

R is a collaborative project with many contributors.
Type 'contributors()' for more information and
'citation()' on how to cite R or R packages in publications.

Type 'demo()' for some demos, 'help()' for on-line help, or
'help.start()' for an HTML browser interface to help.
Type 'q()' to quit R.

> library(ACSWR)
> png(filename="/home/ddbj/snapshot/RGM3/R_CC/result/ACSWR/girder.Rd_%03d_medium.png", width=480, height=480)
> ### Name: girder
> ### Title: Strength Data Set of a Girder Experiment
> ### Aliases: girder
> ### Keywords: median polish
>
> ### ** Examples
>
> data(girder)
> girder
  Girder Aarau Karisruhe Lehigh Cardiff
1   S1.1 0.772     1.186  1.061   1.025
2   S2.1 0.744     1.151  0.992   0.905
3   S3.1 0.767     1.322  1.063   0.930
4   S4.1 0.745     1.339  1.062   0.899
5   S5.1 0.725     1.200  1.065   0.871
6   S1.2 0.844     1.402  1.178   1.004
7   S2.2 0.831     1.365  1.037   0.853
8   S3.2 0.867     1.537  1.086   0.858
9   S4.2 0.859     1.559  1.052   0.805
> boxplot(girder[,2:5])
>
>
>
>
>
> dev.off()
null device
          1
>
|
Created & Maintained by Osamu Ogasawara (osamu.ogasawara@gmail.com) and 