Supported by Dr. Osamu Ogasawara and  . . |
|
Last data update: 2014.03.03 |
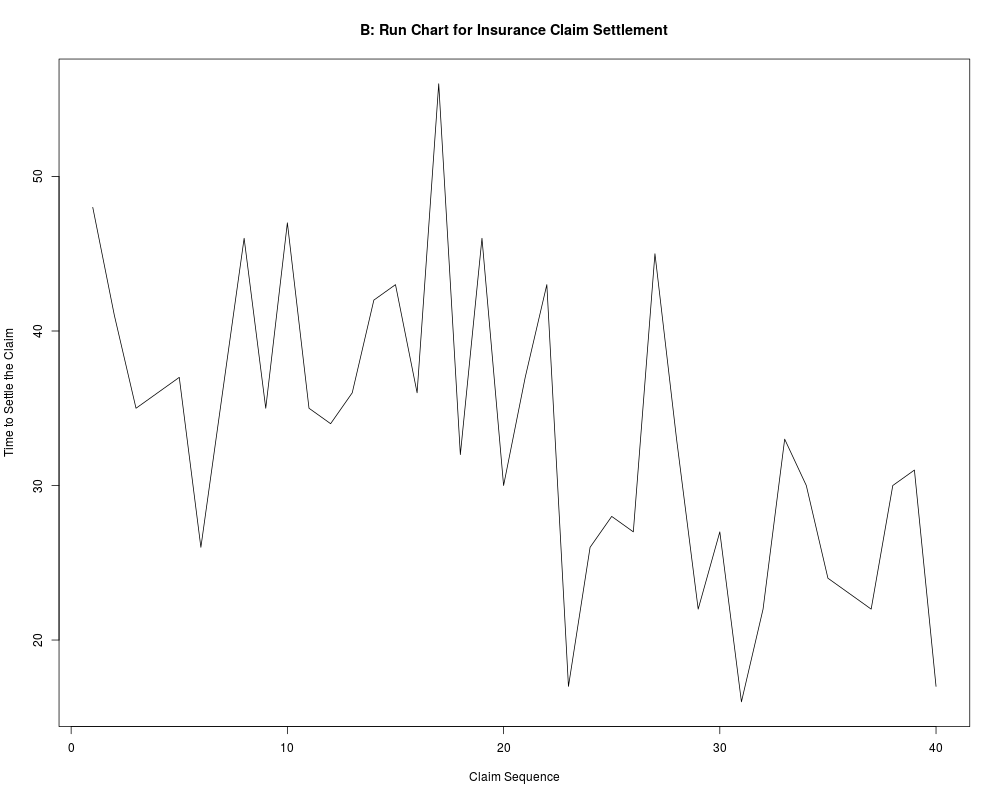
Insurance Claims DataDescriptionMontgomery (2005), page 42, describes this data set in which the number of days taken by the company to process and settle the claims of employee health insurance customers. The data is recorded for the number of days for settlement from the first to fortieth claim. Usagedata(insurance) FormatA data frame with 40 observations on the following 2 variables.
ReferencesMontgomery, D.C. (1985-2012). Introduction to Statistical Quality Control, 7e. J. Wiley. Examples
data(insurance)
plot(insurance$Claim,insurance$Days,"l",xlab="Claim Sequence",
   ylab="Time to Settle the Claim")
title("B: Run Chart for Insurance Claim Settlement")
Results
R version 3.3.1 (2016-06-21) -- "Bug in Your Hair"
Copyright (C) 2016 The R Foundation for Statistical Computing
Platform: x86_64-pc-linux-gnu (64-bit)

R is free software and comes with ABSOLUTELY NO WARRANTY.
You are welcome to redistribute it under certain conditions.
Type 'license()' or 'licence()' for distribution details.

R is a collaborative project with many contributors.
Type 'contributors()' for more information and
'citation()' on how to cite R or R packages in publications.

Type 'demo()' for some demos, 'help()' for on-line help, or
'help.start()' for an HTML browser interface to help.
Type 'q()' to quit R.

> library(ACSWR)
> png(filename="/home/ddbj/snapshot/RGM3/R_CC/result/ACSWR/insurance.Rd_%03d_medium.png", width=480, height=480)
> ### Name: insurance
> ### Title: Insurance Claims Data
> ### Aliases: insurance
> ### Keywords: time series plot
>
> ### ** Examples
>
> data(insurance)
> plot(insurance$Claim,insurance$Days,"l",xlab="Claim Sequence",
+    ylab="Time to Settle the Claim")
> title("B: Run Chart for Insurance Claim Settlement")
>
>
>
>
>
> dev.off()
null device
          1
>
|
Created & Maintained by Osamu Ogasawara (osamu.ogasawara@gmail.com) and 