Supported by Dr. Osamu Ogasawara and  . . |
|
Last data update: 2014.03.03 |
Pareto densityDescriptionA simple function is given here which returns the density function values for a Pareto RV. A more efficient implementation is obtainable in the function "dpareto" from the "VGAM" package. Usagepareto_density(x, scale, shape) Arguments
Author(s)Prabhanjan N. Tattar See AlsoVGAM::dpareto Examples
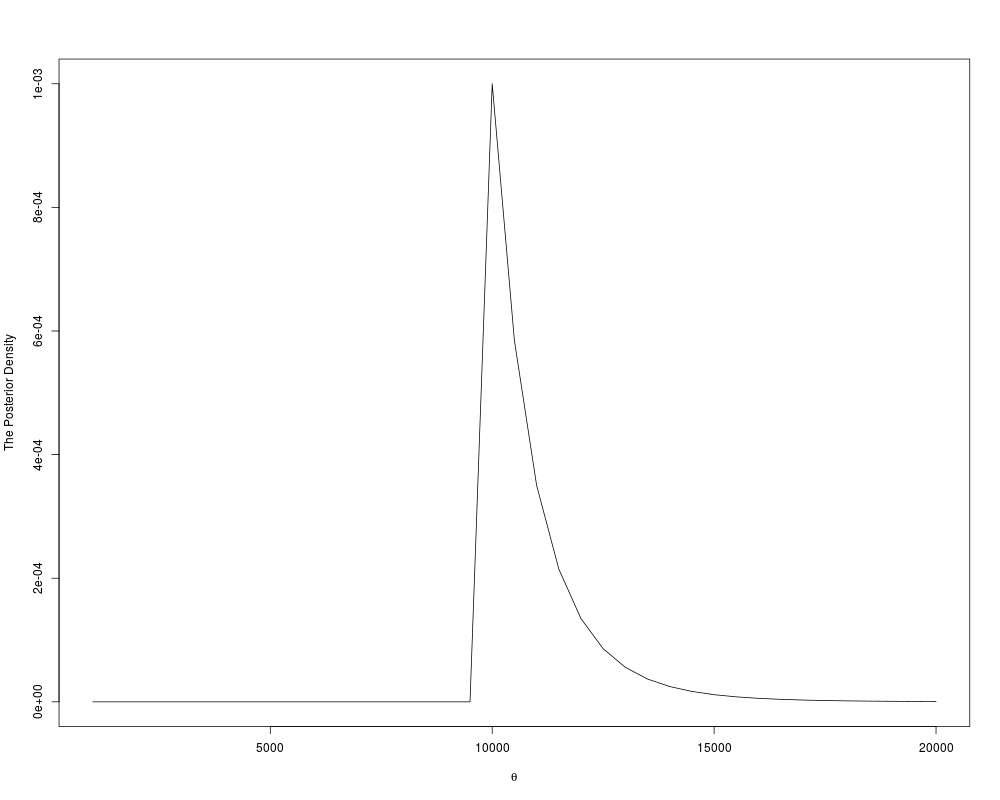
m <- 9184
n <- 103
b <- 10000
K <- 10
theta <- seq(1000,20000,500)
plot(theta,as.numeric(sapply(theta,pareto_density,scale=b,shape=K)),"l",
     xlab=expression(theta),ylab="The Posterior Density")
(n+1)*m/n
Results
R version 3.3.1 (2016-06-21) -- "Bug in Your Hair"
Copyright (C) 2016 The R Foundation for Statistical Computing
Platform: x86_64-pc-linux-gnu (64-bit)

R is free software and comes with ABSOLUTELY NO WARRANTY.
You are welcome to redistribute it under certain conditions.
Type 'license()' or 'licence()' for distribution details.

R is a collaborative project with many contributors.
Type 'contributors()' for more information and
'citation()' on how to cite R or R packages in publications.

Type 'demo()' for some demos, 'help()' for on-line help, or
'help.start()' for an HTML browser interface to help.
Type 'q()' to quit R.

> library(ACSWR)
> png(filename="/home/ddbj/snapshot/RGM3/R_CC/result/ACSWR/pareto_density.Rd_%03d_medium.png", width=480, height=480)
> ### Name: pareto_density
> ### Title: Pareto density
> ### Aliases: pareto_density
> ### Keywords: Pareto Density
>
> ### ** Examples
>
> m <- 9184
> n <- 103
> b <- 10000
> K <- 10
> theta <- seq(1000,20000,500)
> plot(theta,as.numeric(sapply(theta,pareto_density,scale=b,shape=K)),"l",
+      xlab=expression(theta),ylab="The Posterior Density")
> (n+1)*m/n
[1] 9273.165
>
>
>
>
>
> dev.off()
null device
          1
>
|
Created & Maintained by Osamu Ogasawara (osamu.ogasawara@gmail.com) and 