Supported by Dr. Osamu Ogasawara and  . . |
|
Last data update: 2014.03.03 |
A Function to Plot the Power of a UMP Test for Normal DistributionDescriptionA simple function for obtaining the plot of power of UMP test. Usagepowertestplot(mu0, sigma, n, alpha) Arguments
Author(s)Prabhanjan N. Tattar See Alsot.test Examples
UMPNormal <- function(mu0, sigma, n,alpha) {
qnorm(alpha)*sigma/sqrt(n)+mu0
}
UMPNormal(mu0=0, sigma=1,n=1,alpha=0.5)
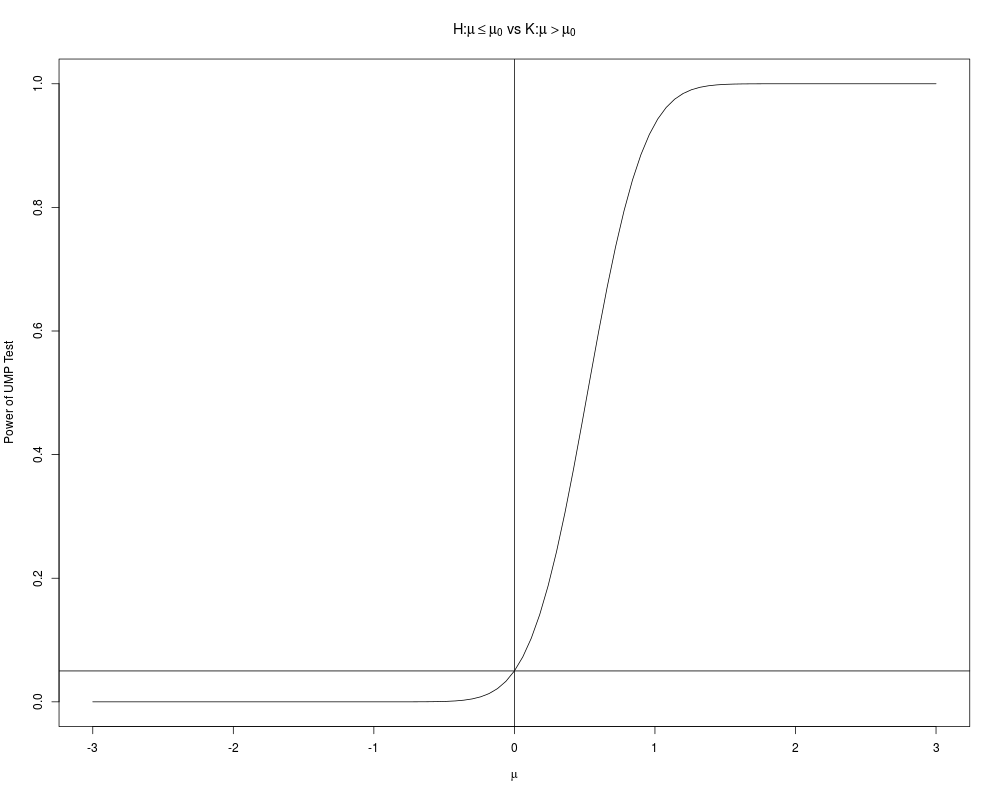
powertestplot <- function(mu0,sigma,n,alpha) {
mu0seq <- seq(mu0-3*sigma, mu0+3*sigma,(6*sigma/100))
betamu <- pnorm(sqrt(n)*(mu0seq-mu0)/sigma-qnorm(1-alpha))
plot(mu0seq,betamu,"l",xlab=expression(mu),ylab="Power of UMP Test",
main = expression(paste("H:",mu <= mu[0]," vs K:",mu>mu[0])))
abline(h=alpha)
abline(v=mu0)
}
powertestplot(mu0=0,sigma=1,n=10,alpha=0.05)
# H:mu > mu_0 vs K: mu <= mu_0
UMPNormal <- function(mu0, sigma, n,alpha) {
mu0-qnorm(alpha)*sigma/sqrt(n)
}
UMPNormal(mu0=0, sigma=1,n=1,alpha=0.5)
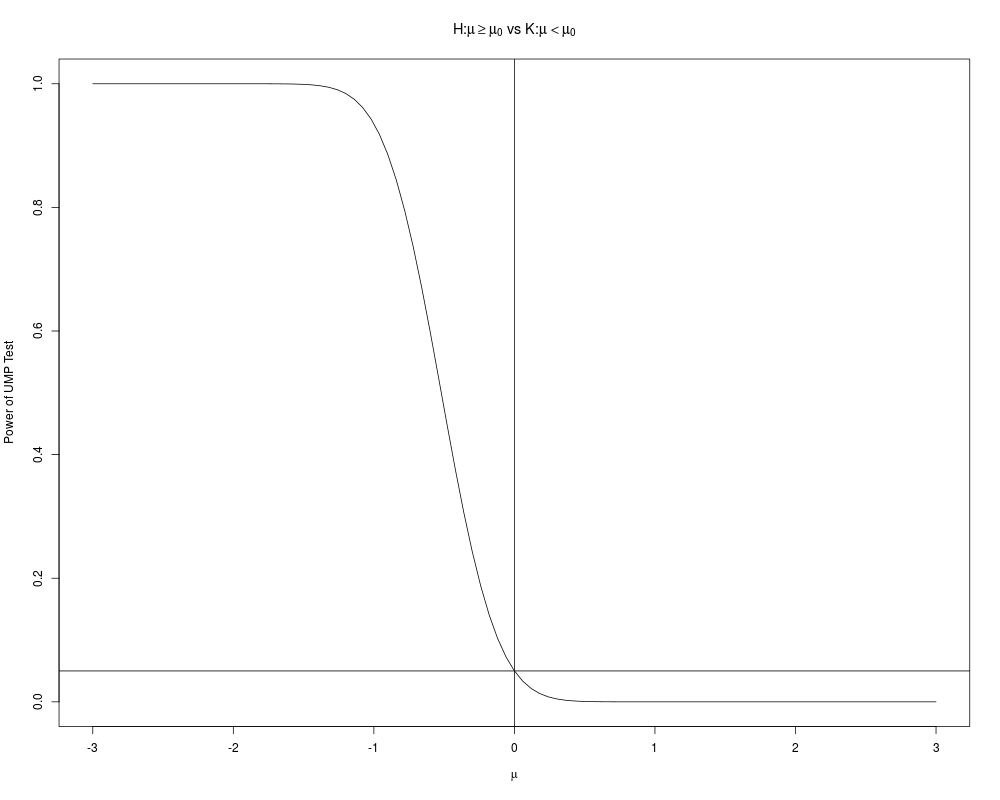
powertestplot <- function(mu0,sigma,n,alpha) {
mu0seq <- seq(mu0-3*sigma, mu0+3*sigma,(6*sigma/100))
betamu <- pnorm(sqrt(n)*(mu0-mu0seq)/sigma-qnorm(1-alpha))
plot(mu0seq,betamu,"l",xlab=expression(mu),ylab="Power of UMP Test",
main=expression(paste("H:",mu >= mu[0]," vs K:",mu<mu[0])))
abline(h=alpha)
abline(v=mu0)
}
powertestplot(mu0=0,sigma=1,n=10,alpha=0.05)
Results
R version 3.3.1 (2016-06-21) -- "Bug in Your Hair"
Copyright (C) 2016 The R Foundation for Statistical Computing
Platform: x86_64-pc-linux-gnu (64-bit)

R is free software and comes with ABSOLUTELY NO WARRANTY.
You are welcome to redistribute it under certain conditions.
Type 'license()' or 'licence()' for distribution details.

R is a collaborative project with many contributors.
Type 'contributors()' for more information and
'citation()' on how to cite R or R packages in publications.

Type 'demo()' for some demos, 'help()' for on-line help, or
'help.start()' for an HTML browser interface to help.
Type 'q()' to quit R.

> library(ACSWR)
> png(filename="/home/ddbj/snapshot/RGM3/R_CC/result/ACSWR/powertestplot.Rd_%03d_medium.png", width=480, height=480)
> ### Name: powertestplot
> ### Title: A Function to Plot the Power of a UMP Test for Normal
> ###   Distribution
> ### Aliases: powertestplot
> ### Keywords: power plot
>
> ### ** Examples
>
> UMPNormal <- function(mu0, sigma, n,alpha)  {
+   qnorm(alpha)*sigma/sqrt(n)+mu0
+ }
> UMPNormal(mu0=0, sigma=1,n=1,alpha=0.5)
[1] 0
> powertestplot <- function(mu0,sigma,n,alpha)	{
+   mu0seq <- seq(mu0-3*sigma, mu0+3*sigma,(6*sigma/100))
+   betamu <- pnorm(sqrt(n)*(mu0seq-mu0)/sigma-qnorm(1-alpha))
+   plot(mu0seq,betamu,"l",xlab=expression(mu),ylab="Power of UMP Test",
+     main = expression(paste("H:",mu <= mu[0]," vs K:",mu>mu[0])))
+   abline(h=alpha)
+   abline(v=mu0)
+ }
> powertestplot(mu0=0,sigma=1,n=10,alpha=0.05)
> # H:mu > mu_0 vs K: mu <= mu_0
> UMPNormal <- function(mu0, sigma, n,alpha)	{
+   mu0-qnorm(alpha)*sigma/sqrt(n)
+ }
> UMPNormal(mu0=0, sigma=1,n=1,alpha=0.5)
[1] 0
> powertestplot <- function(mu0,sigma,n,alpha)	{
+   mu0seq <- seq(mu0-3*sigma, mu0+3*sigma,(6*sigma/100))
+   betamu <- pnorm(sqrt(n)*(mu0-mu0seq)/sigma-qnorm(1-alpha))
+   plot(mu0seq,betamu,"l",xlab=expression(mu),ylab="Power of UMP Test",
+     main=expression(paste("H:",mu >= mu[0]," vs K:",mu<mu[0])))
+   abline(h=alpha)
+   abline(v=mu0)
+ }
> powertestplot(mu0=0,sigma=1,n=10,alpha=0.05)
>
>
>
>
>
> dev.off()
null device
          1
>
|
Created & Maintained by Osamu Ogasawara (osamu.ogasawara@gmail.com) and 