Supported by Dr. Osamu Ogasawara and  . . |
|
Last data update: 2014.03.03 |
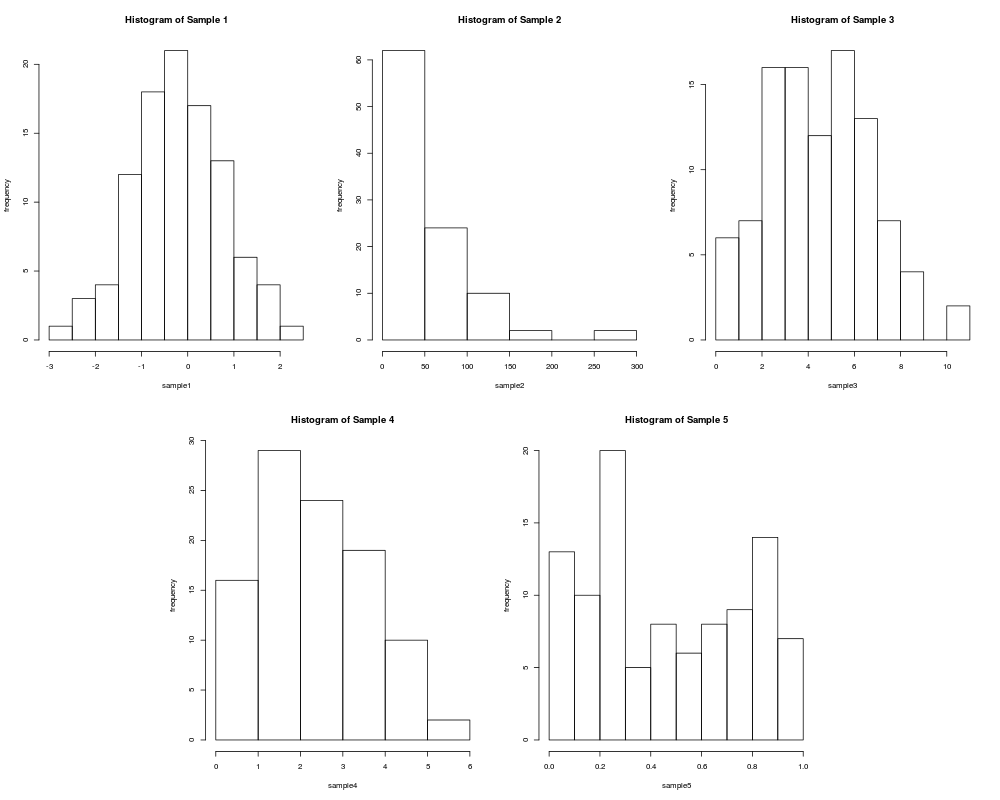
Simulated DatasetDescriptionIn the data set sample, we have data from five different probability distributions. Histograms are used to intuitively understand the underlying probability model. Usagedata(sample) FormatA data frame with 100 observations on the following 5 variables.
Examplesdata(sample) layout(matrix(c(1,1,2,2,3,3,0,4,4,5,5,0), 2, 6, byrow=TRUE),respect=FALSE) matrix(c(1,1,2,2,3,3,0,4,4,5,5,0), 2, 6, byrow=TRUE) hist(sample[,1],main="Histogram of Sample 1",xlab="sample1", ylab="frequency") hist(sample[,2],main="Histogram of Sample 2",xlab="sample2", ylab="frequency") hist(sample[,3],main="Histogram of Sample 3",xlab="sample3", ylab="frequency") hist(sample[,4],main="Histogram of Sample 4",xlab="sample4", ylab="frequency") hist(sample[,5],main="Histogram of Sample 5",xlab="sample5", ylab="frequency") Results
R version 3.3.1 (2016-06-21) -- "Bug in Your Hair"
Copyright (C) 2016 The R Foundation for Statistical Computing
Platform: x86_64-pc-linux-gnu (64-bit)

R is free software and comes with ABSOLUTELY NO WARRANTY.
You are welcome to redistribute it under certain conditions.
Type 'license()' or 'licence()' for distribution details.

R is a collaborative project with many contributors.
Type 'contributors()' for more information and
'citation()' on how to cite R or R packages in publications.

Type 'demo()' for some demos, 'help()' for on-line help, or
'help.start()' for an HTML browser interface to help.
Type 'q()' to quit R.

> library(ACSWR)
> png(filename="/home/ddbj/snapshot/RGM3/R_CC/result/ACSWR/sample.Rd_%03d_medium.png", width=480, height=480)
> ### Name: sample
> ### Title: Simulated Dataset
> ### Aliases: sample
> ### Keywords: histogram
>
> ### ** Examples
>
> data(sample)
> layout(matrix(c(1,1,2,2,3,3,0,4,4,5,5,0), 2, 6, byrow=TRUE),respect=FALSE)
> matrix(c(1,1,2,2,3,3,0,4,4,5,5,0), 2, 6, byrow=TRUE)
     [,1] [,2] [,3] [,4] [,5] [,6]
[1,]    1    1    2    2    3    3
[2,]    0    4    4    5    5    0
> hist(sample[,1],main="Histogram of Sample 1",xlab="sample1", ylab="frequency")
> hist(sample[,2],main="Histogram of Sample 2",xlab="sample2", ylab="frequency")
> hist(sample[,3],main="Histogram of Sample 3",xlab="sample3", ylab="frequency")
> hist(sample[,4],main="Histogram of Sample 4",xlab="sample4", ylab="frequency")
> hist(sample[,5],main="Histogram of Sample 5",xlab="sample5", ylab="frequency")
>
>
>
>
>
> dev.off()
null device
          1
>
|
Created & Maintained by Osamu Ogasawara (osamu.ogasawara@gmail.com) and 