Supported by Dr. Osamu Ogasawara and  . . |
|
Last data update: 2014.03.03 |
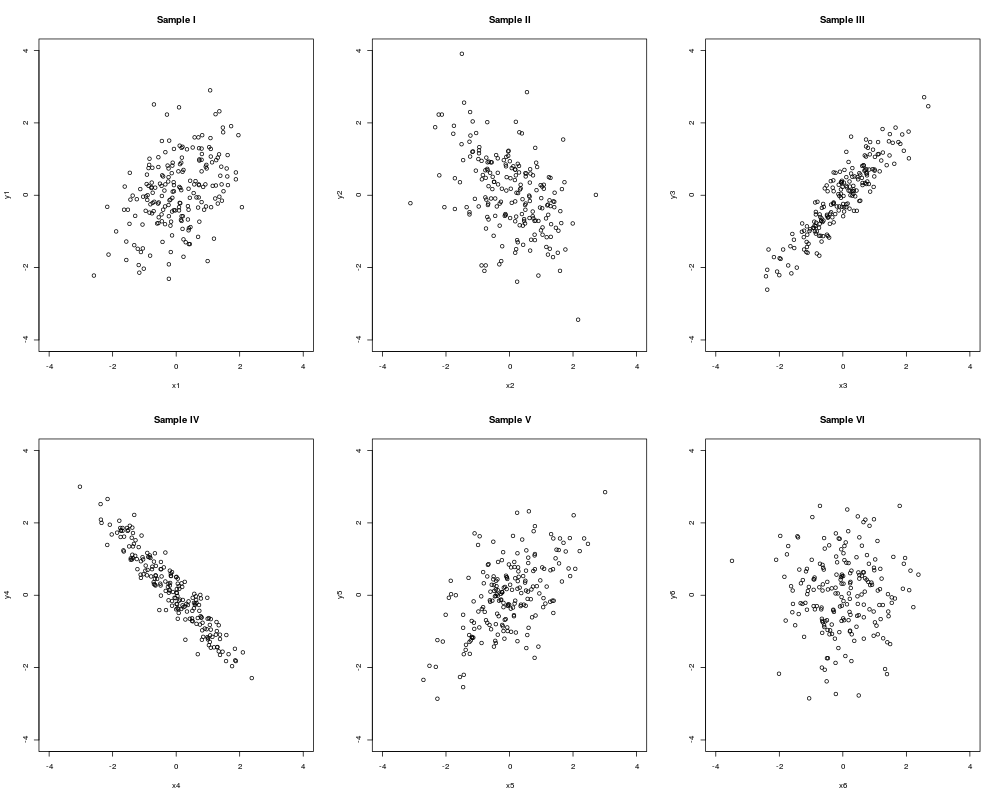
Scatter Plots for Understanding CorrelationsDescriptionA cooked data tailor made for the use of scatter plots towards understanding correlations. Usagedata(somesamples) FormatA data frame with 200 observations on the following 12 variables.
Examplesdata(somesamples) attach(somesamples) par(mfrow=c(2,3)) plot(x1,y1,main="Sample I",xlim=c(-4,4),ylim=c(-4,4)) plot(x2,y2,main="Sample II",xlim=c(-4,4),ylim=c(-4,4)) plot(x3,y3,main="Sample III",xlim=c(-4,4),ylim=c(-4,4)) plot(x4,y4,main="Sample IV",xlim=c(-4,4),ylim=c(-4,4)) plot(x5,y5,main="Sample V",xlim=c(-4,4),ylim=c(-4,4)) plot(x6,y6,main="Sample VI",xlim=c(-4,4),ylim=c(-4,4)) Results
R version 3.3.1 (2016-06-21) -- "Bug in Your Hair"
Copyright (C) 2016 The R Foundation for Statistical Computing
Platform: x86_64-pc-linux-gnu (64-bit)

R is free software and comes with ABSOLUTELY NO WARRANTY.
You are welcome to redistribute it under certain conditions.
Type 'license()' or 'licence()' for distribution details.

R is a collaborative project with many contributors.
Type 'contributors()' for more information and
'citation()' on how to cite R or R packages in publications.

Type 'demo()' for some demos, 'help()' for on-line help, or
'help.start()' for an HTML browser interface to help.
Type 'q()' to quit R.

> library(ACSWR)
> png(filename="/home/ddbj/snapshot/RGM3/R_CC/result/ACSWR/somesamples.Rd_%03d_medium.png", width=480, height=480)
> ### Name: somesamples
> ### Title: Scatter Plots for Understanding Correlations
> ### Aliases: somesamples
> ### Keywords: scatterplot
>
> ### ** Examples
>
> data(somesamples)
> attach(somesamples)
> par(mfrow=c(2,3))
> plot(x1,y1,main="Sample I",xlim=c(-4,4),ylim=c(-4,4))
> plot(x2,y2,main="Sample II",xlim=c(-4,4),ylim=c(-4,4))
> plot(x3,y3,main="Sample III",xlim=c(-4,4),ylim=c(-4,4))
> plot(x4,y4,main="Sample IV",xlim=c(-4,4),ylim=c(-4,4))
> plot(x5,y5,main="Sample V",xlim=c(-4,4),ylim=c(-4,4))
> plot(x6,y6,main="Sample VI",xlim=c(-4,4),ylim=c(-4,4))
>
>
>
>
>
> dev.off()
null device
          1
>
|
Created & Maintained by Osamu Ogasawara (osamu.ogasawara@gmail.com) and 