Supported by Dr. Osamu Ogasawara and  . . |
|
Last data update: 2014.03.03 |
Plotting
|
x |
a |
col |
the colors for the hybrid classes. |
... |
Arguments to be passed to methods, such as graphical parameters (see |
Author(s)
F. Balao fbalao@us.es, J.L. GarcÃa-Castaño
See Also
demosimhybrid
Examples
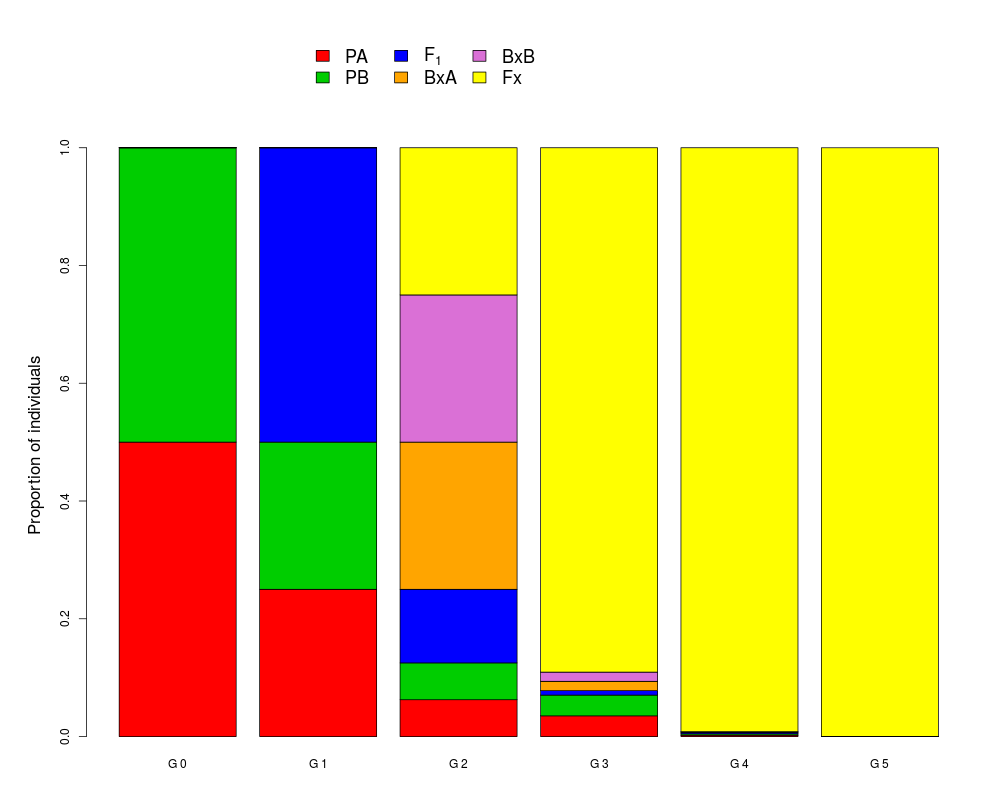
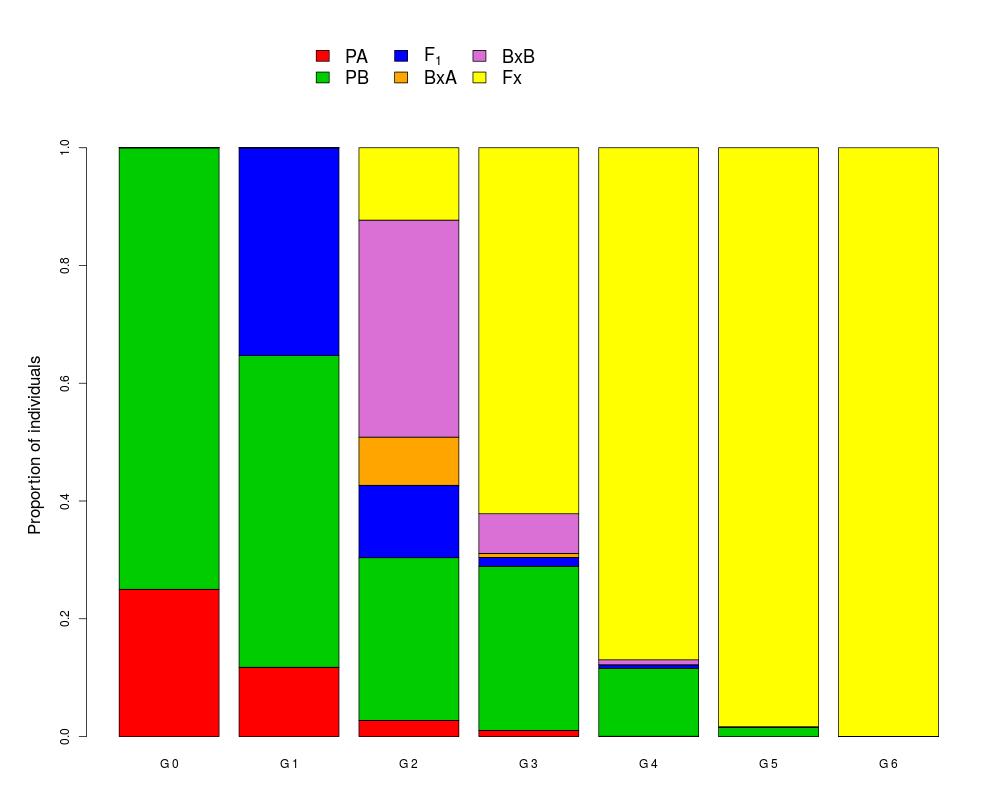
## Example 1. Simulation under parental proportions,
## similar fecundities and random mating
inivalues<-c(0.5,0.5,0,0,0,0)
epi0.5<-demosimhybrid(inivalues)
epi0.5
plot.demosimhybrid(epi0.5)

## Example 2. Simulation under higher frecuency of Parental B,
## and higher fecundy of Parental A and random mating
inivalues2<-c(0.25,0.75,0,0,0,0)
fecundities<-c(1,0.5,0.5,0.5,0.5,0.5)
epi0.75<-demosimhybrid(x=inivalues2, F=fecundities)
epi0.75
plot.demosimhybrid(epi0.75)
Results
R version 3.3.1 (2016-06-21) -- "Bug in Your Hair"
Copyright (C) 2016 The R Foundation for Statistical Computing
Platform: x86_64-pc-linux-gnu (64-bit)

R is free software and comes with ABSOLUTELY NO WARRANTY.
You are welcome to redistribute it under certain conditions.
Type 'license()' or 'licence()' for distribution details.

R is a collaborative project with many contributors.
Type 'contributors()' for more information and
'citation()' on how to cite R or R packages in publications.

Type 'demo()' for some demos, 'help()' for on-line help, or
'help.start()' for an HTML browser interface to help.
Type 'q()' to quit R.

> library(AFLPsim)
> png(filename="/home/ddbj/snapshot/RGM3/R_CC/result/AFLPsim/plot.demosimhybrid.Rd_%03d_medium.png", width=480, height=480)
> ### Name: plot.demosimhybrid
> ### Title: Plotting 'demosimhybrid' objects
> ### Aliases: plot.demosimhybrid
> ### Keywords: hybridization simulation
>
> ### ** Examples
>
> ## Example 1. Simulation under parental proportions,
> ## similar fecundities and random mating
> inivalues<-c(0.5,0.5,0,0,0,0)
> epi0.5<-demosimhybrid(inivalues)
> epi0.5
          PA        PB        F1       BPA       BPB     Fx
G0 5.000e-01 5.000e-01 0.0000000 0.000e+00 0.000e+00 0.0000
G1 2.500e-01 2.500e-01 0.5000000 0.000e+00 0.000e+00 0.0000
G2 6.250e-02 6.250e-02 0.1250000 2.500e-01 2.500e-01 0.2500
G3 3.516e-02 3.516e-02 0.0078120 1.562e-02 1.562e-02 0.8906
G4 2.335e-03 2.335e-03 0.0024719 5.493e-04 5.493e-04 0.9918
G5 8.015e-06 8.015e-06 0.0000109 1.154e-05 1.154e-05 0.9999
attr(,"class")
[1] "demosim.hybrid"
> plot.demosimhybrid(epi0.5)
>
> ## Example 2. Simulation under higher frecuency of Parental B,
> ## and higher fecundy of Parental A and random mating
> inivalues2<-c(0.25,0.75,0,0,0,0)
> fecundities<-c(1,0.5,0.5,0.5,0.5,0.5)
> epi0.75<-demosimhybrid(x=inivalues2, F=fecundities)
> epi0.75
          PA       PB        F1       BPA       BPB     Fx
G0 2.500e-01 0.750000 0.000e+00 0.000e+00 0.000e+00 0.0000
G1 1.176e-01 0.529400 3.529e-01 0.000e+00 0.000e+00 0.0000
G2 2.730e-02 0.276450 1.229e-01 8.191e-02 3.686e-01 0.1229
G3 1.038e-02 0.278770 1.502e-02 6.675e-03 6.758e-02 0.6216
G4 4.927e-04 0.115363 5.787e-03 3.118e-04 8.371e-03 0.8697
G5 1.100e-06 0.015240 1.137e-04 5.703e-06 1.335e-03 0.9833
G6 2.751e-11 0.000273 3.353e-08 2.501e-10 3.465e-06 0.9997
attr(,"class")
[1] "demosim.hybrid"
> plot.demosimhybrid(epi0.75)
>
>
>
>
>
> dev.off()
null device
          1
>
|
Created & Maintained by Osamu Ogasawara (osamu.ogasawara@gmail.com) and 