Supported by Dr. Osamu Ogasawara and  . . |
|
Last data update: 2014.03.03 |
Calculate the shifted PSD matrixDescription
UsageshiftedPSDuv(AFMImage) Arguments
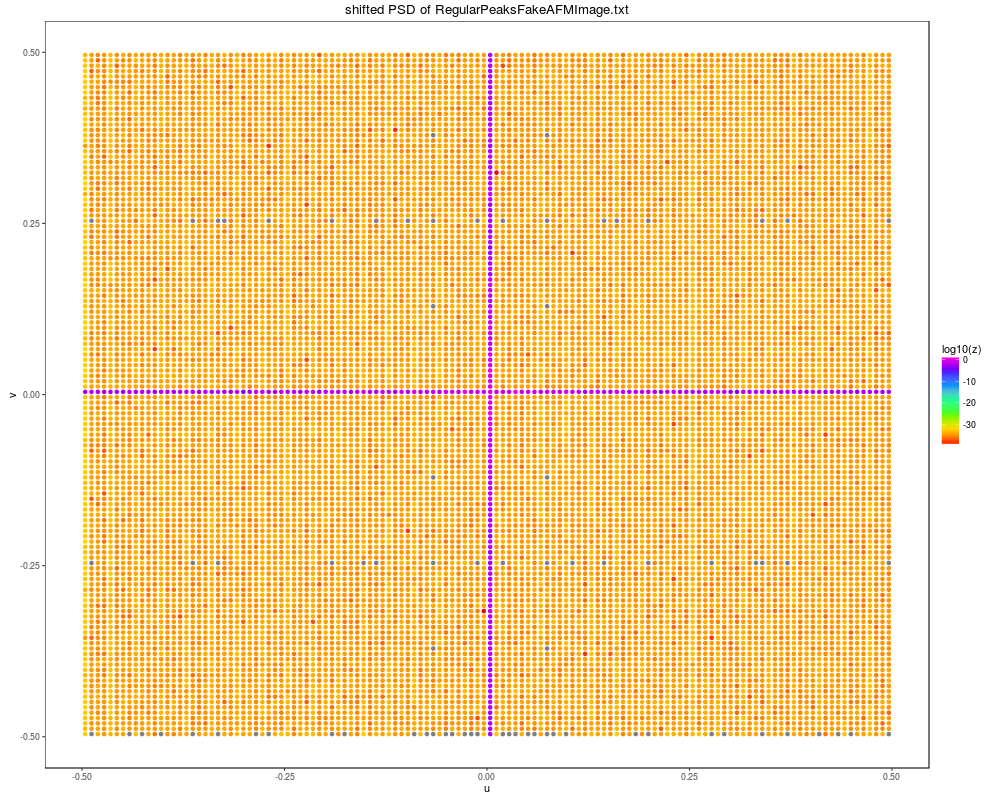
Value(1/NM^2) * abs(shiftedFFT2Ddata)^2) with N the number of lines of the sample and M the number of samples per line of the sample Author(s)M.Beauvais Examples
library(AFM)
library(ggplot2)

data(AFMImageOfRegularPeaks)
AFMImage<-AFMImageOfRegularPeaks
nMheightsData= matrix(AFMImage@data$h, nrow=AFMImage@samplesperline)
shiftedPSDuv<-shiftedPSDuv(AFMImage)
a=AFMImage@scansize
b=AFMImage@scansize

M=AFMImage@sampsline
N=AFMImage@lines
NM=N*M # pixels^2
MN = M*N
A=a*b
ab=a*b

dx=a/M
dy=b/N

um = seq( (1-(M+1)/2)/(M*dx), (M-(M+1)/2)/(M*dx), by=1/(M*dx))
vn = seq( (1-(N+1)/2)/(N*dy), (N-(N+1)/2)/(N*dy), by=1/(N*dy))
x = rep(um, times = AFMImage@lines)
y = rep(vn, each = AFMImage@sampsline)
z = as.vector(shiftedPSDuv)

data<-data.frame(x=x, y=y, z=z)

p5 <- qplot(x, y, data=data, colour=log10(z))
p5 <- p5 + scale_colour_gradientn(colours = rainbow(7))
p5 <- p5 + ylab("v")
p5 <- p5 + xlab("u")
title<-paste("shifted PSD of", basename(AFMImage@fullfilename))
p5 <- p5 + ggtitle(title)
# Hide all the horizontal gridlines
p5 <- p5 + theme(panel.grid.minor.x=element_blank(), panel.grid.major.x=element_blank())
# Hide all the vertical gridlines
p5 <- p5 + theme(panel.grid.minor.y=element_blank(), panel.grid.major.y=element_blank())
p5 <- p5 + theme(panel.background = element_rect(fill = 'white', colour = 'black'))
p5
Results
R version 3.3.1 (2016-06-21) -- "Bug in Your Hair"
Copyright (C) 2016 The R Foundation for Statistical Computing
Platform: x86_64-pc-linux-gnu (64-bit)

R is free software and comes with ABSOLUTELY NO WARRANTY.
You are welcome to redistribute it under certain conditions.
Type 'license()' or 'licence()' for distribution details.

R is a collaborative project with many contributors.
Type 'contributors()' for more information and
'citation()' on how to cite R or R packages in publications.

Type 'demo()' for some demos, 'help()' for on-line help, or
'help.start()' for an HTML browser interface to help.
Type 'q()' to quit R.

> library(AFM)
> png(filename="/home/ddbj/snapshot/RGM3/R_CC/result/AFM/shiftedPSDuv.Rd_%03d_medium.png", width=480, height=480)
> ### Name: shiftedPSDuv
> ### Title: Calculate the shifted PSD matrix
> ### Aliases: shiftedPSDuv
>
> ### ** Examples
>
> library(AFM)
> library(ggplot2)
>
> data(AFMImageOfRegularPeaks)
> AFMImage<-AFMImageOfRegularPeaks
> nMheightsData= matrix(AFMImage@data$h, nrow=AFMImage@samplesperline)
> shiftedPSDuv<-shiftedPSDuv(AFMImage)
> a=AFMImage@scansize
> b=AFMImage@scansize
>
> M=AFMImage@sampsline
> N=AFMImage@lines
> NM=N*M # pixels^2
> MN = M*N
> A=a*b
> ab=a*b
>
> dx=a/M
> dy=b/N
>
> um = seq( (1-(M+1)/2)/(M*dx), (M-(M+1)/2)/(M*dx), by=1/(M*dx))
> vn = seq( (1-(N+1)/2)/(N*dy), (N-(N+1)/2)/(N*dy), by=1/(N*dy))
> x = rep(um, times = AFMImage@lines)
> y = rep(vn, each = AFMImage@sampsline)
> z = as.vector(shiftedPSDuv)
>
> data<-data.frame(x=x, y=y, z=z)
>
> p5 <- qplot(x, y, data=data, colour=log10(z))
> p5 <- p5 + scale_colour_gradientn(colours = rainbow(7))
> p5 <- p5 + ylab("v")
> p5 <- p5 + xlab("u")
> title<-paste("shifted PSD of", basename(AFMImage@fullfilename))
> p5 <- p5 + ggtitle(title)
> # Hide all the horizontal gridlines
> p5 <- p5 + theme(panel.grid.minor.x=element_blank(), panel.grid.major.x=element_blank())
> # Hide all the vertical gridlines
> p5 <- p5 + theme(panel.grid.minor.y=element_blank(), panel.grid.major.y=element_blank())
> p5 <- p5 + theme(panel.background = element_rect(fill = 'white', colour = 'black'))
> p5
>
>
>
>
>
> dev.off()
null device
          1
>
|
Created & Maintained by Osamu Ogasawara (osamu.ogasawara@gmail.com) and 