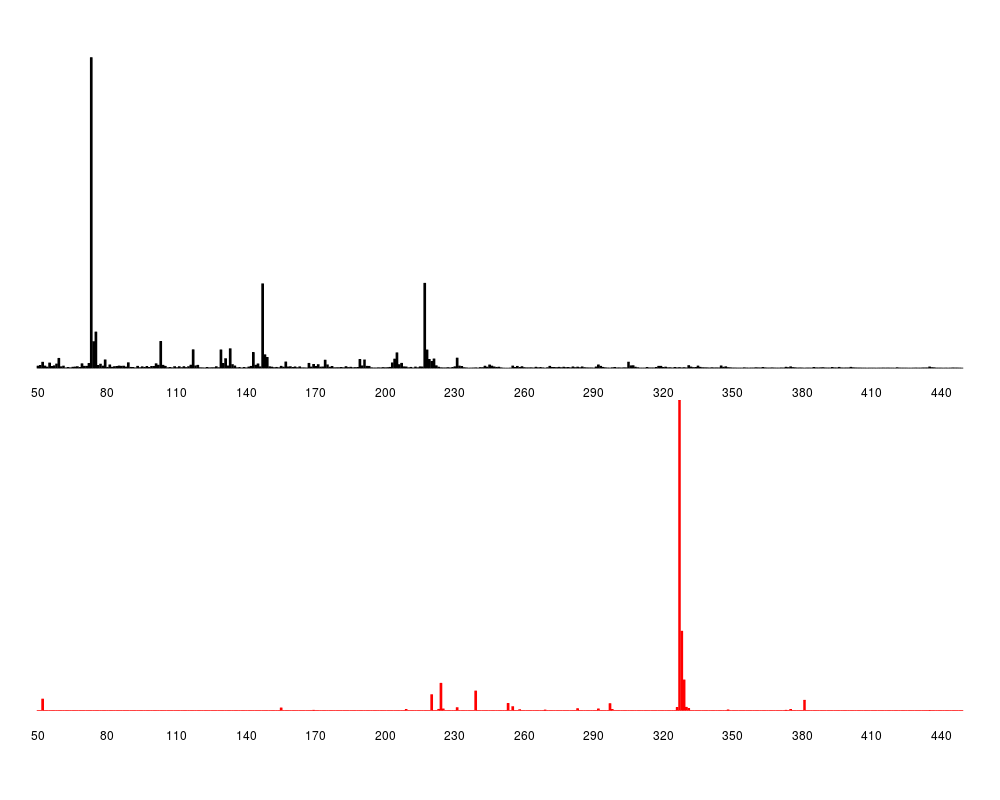
matrix representing mass spectra of dimension n by
comp where comp is the number of spectra
x2
vector of masses that label the rows of S
out
if "", the plot is written to the current device; if
"ps" a postscript file is written and if "pdf" then a pdf file
is written
filename
character vector specifying the name of the file to write
if out=TRUE
col
if length is greater than zero, then the color to plot each
spectrum
cex
cex A numerical value giving the amount by which
plotting text and symbols should be magnified relative to the
default.
lab
cex.lab A character vector used as y-axis label.
cex.lab
cex.lab A numerical value giving
magnification to be used for x and y labels relative
to the default.
Author(s)
Katharine M. Mullen
See Also
als
Examples
## load example mass spectra S and vector of m/z values x2
data(multiex)

plotS(S,x2)
Results
R version 3.3.1 (2016-06-21) -- "Bug in Your Hair"
Copyright (C) 2016 The R Foundation for Statistical Computing
Platform: x86_64-pc-linux-gnu (64-bit)

R is free software and comes with ABSOLUTELY NO WARRANTY.
You are welcome to redistribute it under certain conditions.
Type 'license()' or 'licence()' for distribution details.

R is a collaborative project with many contributors.
Type 'contributors()' for more information and
'citation()' on how to cite R or R packages in publications.

Type 'demo()' for some demos, 'help()' for on-line help, or
'help.start()' for an HTML browser interface to help.
Type 'q()' to quit R.

> library(ALS)
Loading required package: nnls
Loading required package: Iso
Iso 0.0-17
> png(filename="/home/ddbj/snapshot/RGM3/R_CC/result/ALS/plotS.Rd_%03d_medium.png", width=480, height=480)
> ### Name: plotS
> ### Title: Plots a matrix representing mass spectra
> ### Aliases: plotS
> ### Keywords: hplot
>
> ### ** Examples
>
> ## load example mass spectra S and vector of m/z values x2
> data(multiex)
>
> plotS(S,x2)
>
>
>
>
>
>
> dev.off()
null device
          1
>
 .
.