Supported by Dr. Osamu Ogasawara and  . . |
|
Last data update: 2014.03.03 |
A Multidirectional Optimum Ecotope-Based AlgorithmDescriptionA function to calculate spatial clusters using the Getis-Ord local statistic (Ord and Getis, 1995). It searches irregular clusters (ecotopes) on a map through boundaries or grid of it. UsageAMOEBA(outc, neig, power = 1, cpu = 1) Arguments
Detailsoutc must be the same lenght as the total number of units in neig. power must be a positive integer. This value tell us how many times the AMOEBA is applied. When you apply the algorithm one time, the algorithm is called AMOEBA (Aldstadt and Getis, 2006; Duque et al., 2011), but when you apply more than one time, the algorithm is called AMOEBA+. cpu must be a positive integer. Also, be careful and no put a cpu bigger than you have in your computer because it still will work but it probably will take long time. This value helps the function with his computational time, because it is used in the parallelization of the algorithm (Widener et al, 2012). ValueReturn a vector with the classification of the outcome. The classification is ordered from lowest (low risk) to high (high risk). Also, it has as much 3 ^ power levels of risk. AcknowledgmentsThis work is included within the project "A longitudinal multilevel analysis of socioeconomic disparities in cardiovascular diseases: questioning past evidence with new methodological approaches" supported by a grant from The Swedish Research Council (#D054740, PI: Juan Merlo). Notepower should satisfy that 3 ^ power < length ( outc ), because otherwise it is meaningless and the algorithm will fail. For example in the columbus example, the map have length of 49 so you can put a power as much of 3. More than this value it will fail. In cpu you should use more than 1 CPU when your area of study is huge, because otherwise it will increase the computation time in a small area. If you decide to change the value here an advice, put 80% of your computer's CPU for more efficient performance of the algorithm. For exapmle, if your computer have 8 CPU, you should input "cpu=6". Author(s)Guillermo Valles. ReferencesOrd, J. K. and Getis, A. (1995). Local spatial autocorrelation statistics: Distributional issues and application. Aldstadt, J. and Getis, A. (2006). Using AMOEBA to create a spatial weights matrix and identify spatial clusters. Duque, J. C., Aldstadt, J., Velasquez, E., Franco, J. L., and Betancourt, A. (2011). A computationally efficient method for delineating irregularly shaped spatial clusters. Widener, M. J., Crago, N. C., and Aldstadt, J. (2012). Developing a parallel computational implementation of AMOEBA. Examples
####################
##### Shiny App
# Visit: http://amoeba-spatial-cluster.shinyapps.io/AMOEBA/
####################
##### R App
require(AMOEBA)
### Columbus OH spatial analysis data set (spdep package)
data(columbus)
require(maptools)
map<-readShapePoly(system.file('etc/shapes/columbus.shp',package='spdep')[1])
### Application of AMOEBA
res<-AMOEBA(columbus$CRIME,col.gal.nb,1,1)
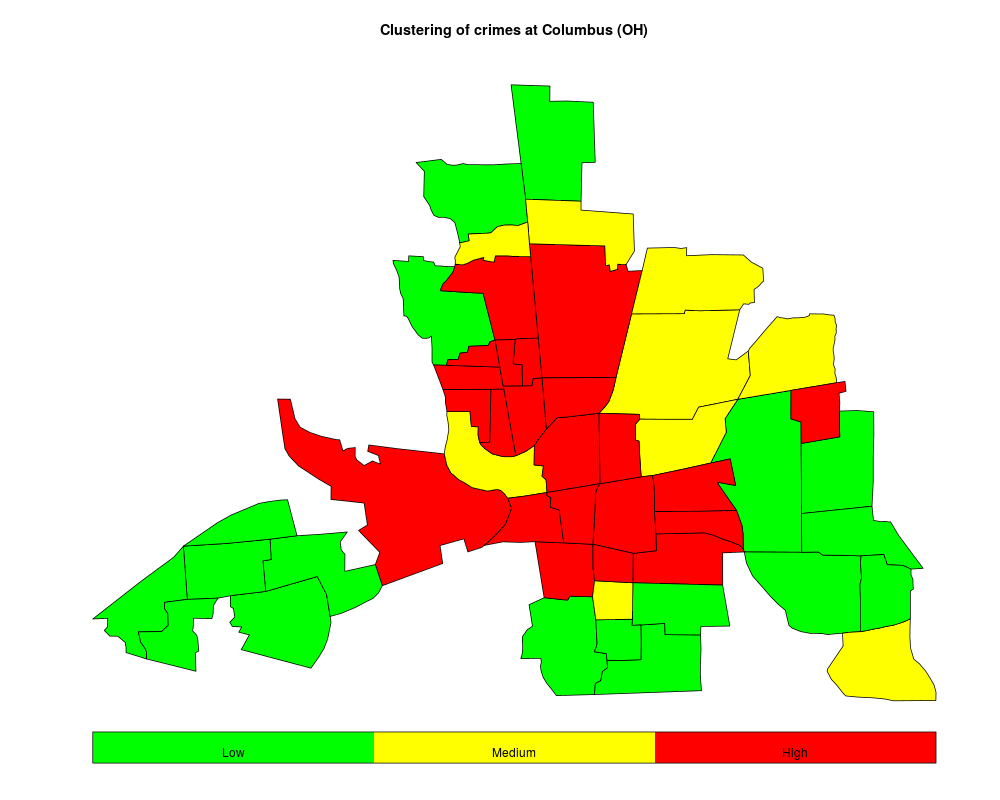
### Plot
color<-rev(rainbow(length(table(res)),start=0,end=2/6))
plot(map,col=color[as.factor(res)])
title('Clustering of crimes at Columbus (OH)')
names<-c('\nLow','\nMedium','\nHigh')
require(plotrix)
color.legend(map@bbox[1,1],map@bbox[2,1]-0.2,map@bbox[1,2],map@bbox[2,1]-0.4,names,color,align='rb')
Results
R version 3.3.1 (2016-06-21) -- "Bug in Your Hair"
Copyright (C) 2016 The R Foundation for Statistical Computing
Platform: x86_64-pc-linux-gnu (64-bit)

R is free software and comes with ABSOLUTELY NO WARRANTY.
You are welcome to redistribute it under certain conditions.
Type 'license()' or 'licence()' for distribution details.

R is a collaborative project with many contributors.
Type 'contributors()' for more information and
'citation()' on how to cite R or R packages in publications.

Type 'demo()' for some demos, 'help()' for on-line help, or
'help.start()' for an HTML browser interface to help.
Type 'q()' to quit R.

> library(AMOEBA)
Loading required package: snowfall
Loading required package: snow
Loading required package: rlecuyer
Loading required package: spdep
Loading required package: sp
Loading required package: Matrix
> png(filename="/home/ddbj/snapshot/RGM3/R_CC/result/AMOEBA/AMOEBA.Rd_%03d_medium.png", width=480, height=480)
> ### Name: AMOEBA
> ### Title: A Multidirectional Optimum Ecotope-Based Algorithm
> ### Aliases: AMOEBA
> ### Keywords: spatial cluster
>
> ### ** Examples
>
> ####################
> ##### Shiny App
> # Visit: http://amoeba-spatial-cluster.shinyapps.io/AMOEBA/
>
> ####################
> ##### R App
> require(AMOEBA)
>
> ### Columbus OH spatial analysis data set (spdep package)
> data(columbus)
> require(maptools)
Loading required package: maptools
Checking rgeos availability: TRUE
> map<-readShapePoly(system.file('etc/shapes/columbus.shp',package='spdep')[1])
>
> ### Application of AMOEBA
> res<-AMOEBA(columbus$CRIME,col.gal.nb,1,1)
R Version:  R version 3.3.1 (2016-06-21)

snowfall 1.84-6.1 initialized (using snow 0.4-1): parallel execution on 1 CPUs.


Stopping cluster

>
> ### Plot
> color<-rev(rainbow(length(table(res)),start=0,end=2/6))
> plot(map,col=color[as.factor(res)])
> title('Clustering of crimes at Columbus (OH)')
> names<-c('\nLow','\nMedium','\nHigh')
> require(plotrix)
Loading required package: plotrix
> color.legend(map@bbox[1,1],map@bbox[2,1]-0.2,map@bbox[1,2],map@bbox[2,1]-0.4,names,color,align='rb')
>
>
>
>
>
> dev.off()
null device
          1
>
|