Supported by Dr. Osamu Ogasawara and  . . |
|
Last data update: 2014.03.03 |
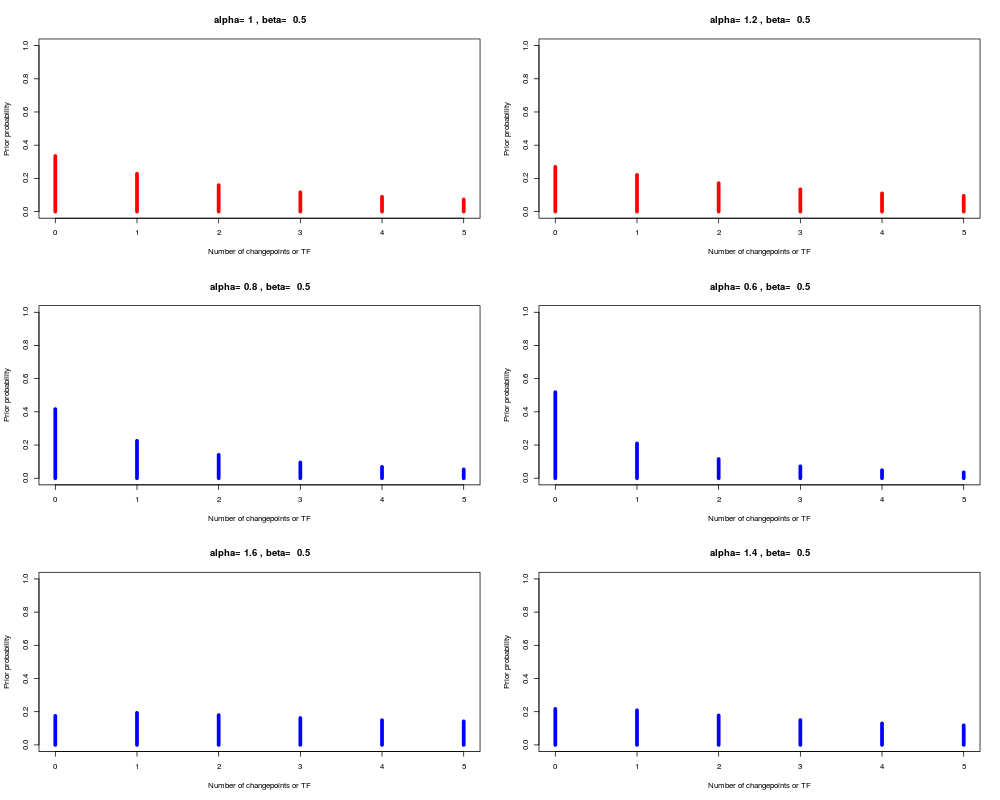
Function to plot an overview of possible priors for the number of changepoints and/or edges.DescriptionPlots an overview of some possible priors used in the
UsagechoosePriors(kmax,priors) Arguments
ValueNULL, a graph is plotted. Author(s)S. Lebre and G. Lelandais. ReferencesS. Lebre, J. Becq, F. Devaux, M. P. H. Stumpf, G. Lelandais (2010) Statistical inference of the time-varying structure of gene-regulation networks, BMC Systems Biology, 4:130. See Also
Examples# See some prior probabbility density when the maximal number of # CPs/parents is equal to 5 data(priors) choosePriors(kmax=5,priors) Results
R version 3.3.1 (2016-06-21) -- "Bug in Your Hair"
Copyright (C) 2016 The R Foundation for Statistical Computing
Platform: x86_64-pc-linux-gnu (64-bit)

R is free software and comes with ABSOLUTELY NO WARRANTY.
You are welcome to redistribute it under certain conditions.
Type 'license()' or 'licence()' for distribution details.

R is a collaborative project with many contributors.
Type 'contributors()' for more information and
'citation()' on how to cite R or R packages in publications.

Type 'demo()' for some demos, 'help()' for on-line help, or
'help.start()' for an HTML browser interface to help.
Type 'q()' to quit R.

> library(ARTIVA)
Loading required package: MASS
Loading required package: igraph

Attaching package: 'igraph'

The following objects are masked from 'package:stats':

    decompose, spectrum

The following object is masked from 'package:base':

    union

Loading required package: gplots

Attaching package: 'gplots'

The following object is masked from 'package:stats':

    lowess

> png(filename="/home/ddbj/snapshot/RGM3/R_CC/result/ARTIVA/choosePriors.Rd_%03d_medium.png", width=480, height=480)
> ### Name: choosePriors
> ### Title: Function to plot an overview of possible priors for the number
> ###   of changepoints and/or edges.
> ### Aliases: choosePriors
> ### Keywords: util
>
> ### ** Examples
>
> # See some prior probabbility density when the maximal number of
> # CPs/parents is equal to 5
> data(priors)
> choosePriors(kmax=5,priors)
>
>
>
>
>
> dev.off()
null device
          1
>
|