Supported by Dr. Osamu Ogasawara and  . . |
|
Last data update: 2014.03.03 |
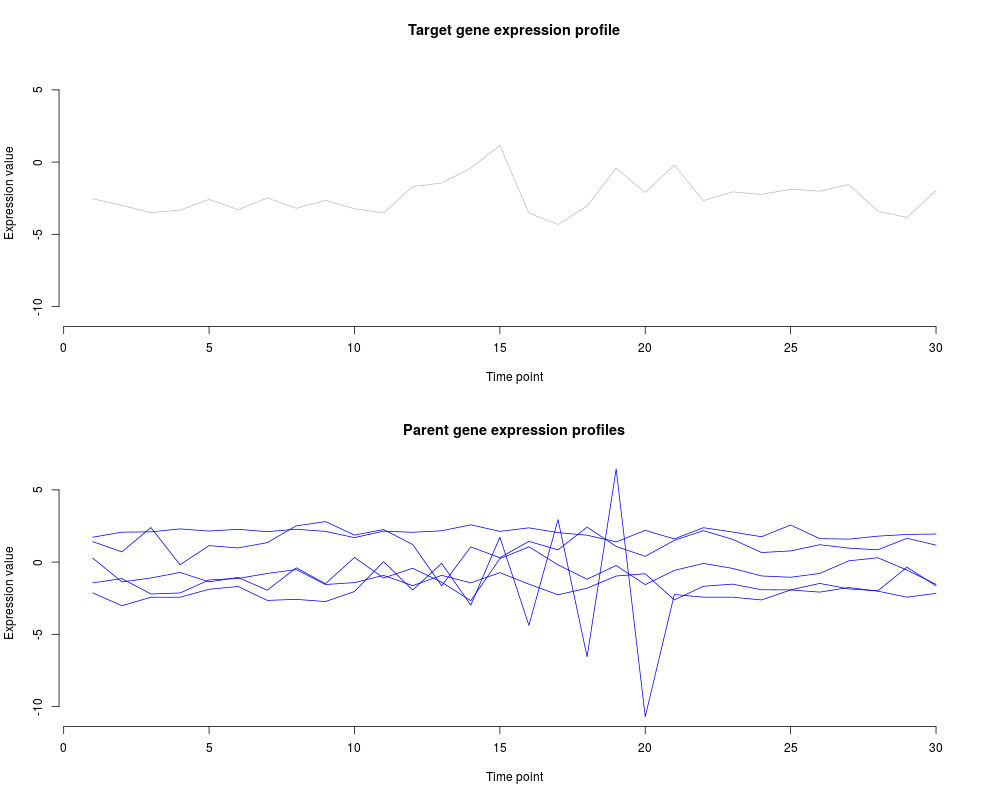
Function to plot the gene expression profilesDescriptionThis function is used for plotting the target and parent gene expression profiles. UsagetraceGeneProfiles(targetData, parentData, dataDescription=NULL, targetColor = "grey", parentColor = "blue", onepage=TRUE) Arguments
ValueNULL Author(s)S. Lebre and G. Lelandais. ReferencesStatistical inference of the time-varying structure of gene-regulation networks S. Lebre, J. Becq, F. Devaux, M. P. H. Stumpf, G. Lelandais, BMC Systems Biology, 4:130, 2010. See Also
Examples
# Load the R package ARTIVA
library(ARTIVA)

# Load the dataset with simulated gene expression profiles
data(simulatedProfiles)

# Name of the target gene to be analyzed with ARTIVA
targetGene = 1

# Names of the parent genes (typically transcription factors)
parentGenes = c("TF1", "TF2", "TF3", "TF4", "TF5")

# Plot of the gene expression profiles for target gene and parent genes
traceGeneProfiles(targetData= simulatedProfiles[targetGene,],
		  parentData= simulatedProfiles[parentGenes,])
Results
R version 3.3.1 (2016-06-21) -- "Bug in Your Hair"
Copyright (C) 2016 The R Foundation for Statistical Computing
Platform: x86_64-pc-linux-gnu (64-bit)

R is free software and comes with ABSOLUTELY NO WARRANTY.
You are welcome to redistribute it under certain conditions.
Type 'license()' or 'licence()' for distribution details.

R is a collaborative project with many contributors.
Type 'contributors()' for more information and
'citation()' on how to cite R or R packages in publications.

Type 'demo()' for some demos, 'help()' for on-line help, or
'help.start()' for an HTML browser interface to help.
Type 'q()' to quit R.

> library(ARTIVA)
Loading required package: MASS
Loading required package: igraph

Attaching package: 'igraph'

The following objects are masked from 'package:stats':

    decompose, spectrum

The following object is masked from 'package:base':

    union

Loading required package: gplots

Attaching package: 'gplots'

The following object is masked from 'package:stats':

    lowess

> png(filename="/home/ddbj/snapshot/RGM3/R_CC/result/ARTIVA/traceGeneProfiles.Rd_%03d_medium.png", width=480, height=480)
> ### Name: traceGeneProfiles
> ### Title: Function to plot the gene expression profiles
> ### Aliases: traceGeneProfiles
> ### Keywords: graphics util
>
> ### ** Examples
>
> # Load the R package ARTIVA
> library(ARTIVA)
>
> # Load the dataset with simulated gene expression profiles
> data(simulatedProfiles)
>
> # Name of the target gene to be analyzed with ARTIVA
> targetGene = 1
>
> # Names of the parent genes (typically transcription factors)
> parentGenes = c("TF1", "TF2", "TF3", "TF4", "TF5")
>
> # Plot of the gene expression profiles for target gene and parent genes
> traceGeneProfiles(targetData= simulatedProfiles[targetGene,],
+ 		  parentData= simulatedProfiles[parentGenes,])
>
>
>
>
>
>
> dev.off()
null device
          1
>
|