Supported by Dr. Osamu Ogasawara and  . . |
|
Last data update: 2014.03.03 |
Profile individual genotype statistics for an R/qtl cross objectDescriptionProfile individual genotype statistics for the current linkage map order of and R/qtl cross object Usage
profileGen(cross, chr, bychr = TRUE, stat.type = c("xo", "dxo", "miss"),
           id = "Genotype", xo.lambda = NULL, ...)
Arguments
DetailsThis function uses If a numerical value is given for ValueA lattice panel plot with panels described by the Author(s)Julian Taylor See Also
Examples
data(mapDH, package = "ASMap")
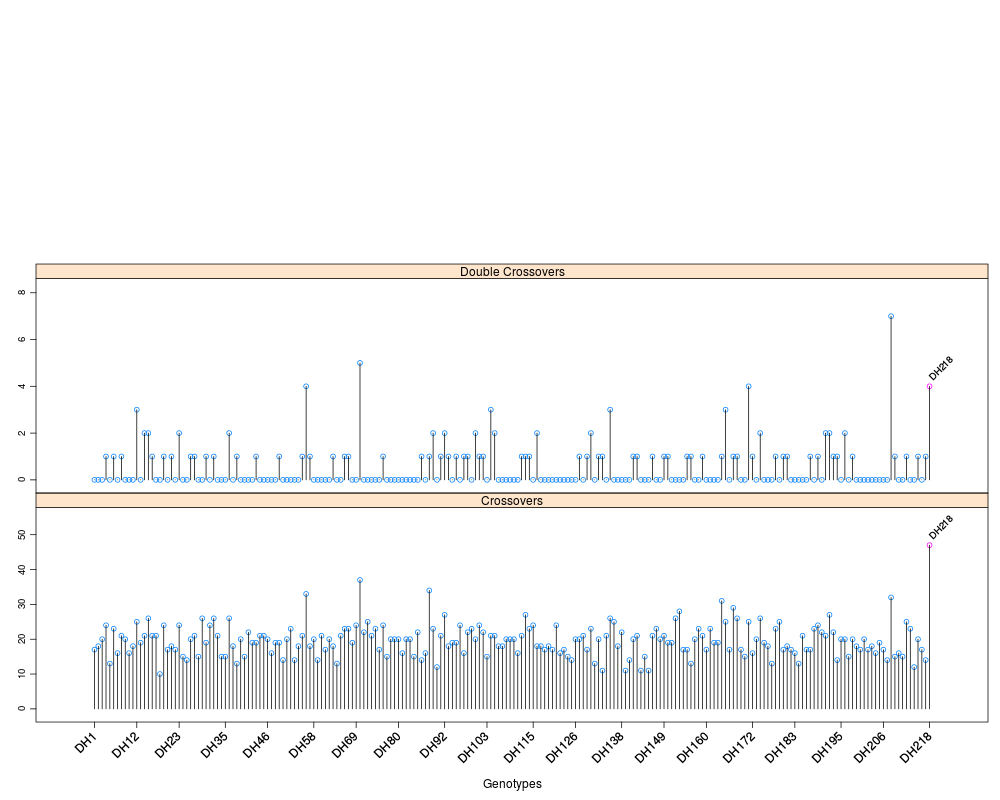
## profile all genotype crossover and double crossover statistics
profileGen(mapDH, bychr = FALSE, stat.type = c("xo","dxo"),
xo.lambda = 25, layout = c(1,3))
Results
R version 3.3.1 (2016-06-21) -- "Bug in Your Hair"
Copyright (C) 2016 The R Foundation for Statistical Computing
Platform: x86_64-pc-linux-gnu (64-bit)

R is free software and comes with ABSOLUTELY NO WARRANTY.
You are welcome to redistribute it under certain conditions.
Type 'license()' or 'licence()' for distribution details.

R is a collaborative project with many contributors.
Type 'contributors()' for more information and
'citation()' on how to cite R or R packages in publications.

Type 'demo()' for some demos, 'help()' for on-line help, or
'help.start()' for an HTML browser interface to help.
Type 'q()' to quit R.

> library(ASMap)
Loading required package: qtl
Loading required package: gtools
Loading required package: fields
Loading required package: spam
Loading required package: grid
Spam version 1.3-0 (2015-10-24) is loaded.
Type 'help( Spam)' or 'demo( spam)' for a short introduction
and overview of this package.
Help for individual functions is also obtained by adding the
suffix '.spam' to the function name, e.g. 'help( chol.spam)'.

Attaching package: 'spam'

The following objects are masked from 'package:base':

    backsolve, forwardsolve

Loading required package: maps

 # maps v3.1: updated 'world': all lakes moved to separate new #
 # 'lakes' database. Type '?world' or 'news(package="maps")'.  #


Loading required package: RColorBrewer
Loading required package: lattice
> png(filename="/home/ddbj/snapshot/RGM3/R_CC/result/ASMap/profileGen.Rd_%03d_medium.png", width=480, height=480)
> ### Name: profileGen
> ### Title: Profile individual genotype statistics for an R/qtl cross object
> ### Aliases: profileGen
> ### Keywords: misc
>
> ### ** Examples
>
>
> data(mapDH, package = "ASMap")
>
> ## profile all genotype crossover and double crossover statistics
>
> profileGen(mapDH, bychr = FALSE, stat.type = c("xo","dxo"),
+      xo.lambda = 25, layout = c(1,3))
>
>
>
>
>
>
> dev.off()
null device
          1
>
|