Supported by Dr. Osamu Ogasawara and  . . |
|
Last data update: 2014.03.03 |
Profile individual marker and interval statistics for an R/qtl cross objectDescriptionGraphically profile individual marker and interval statistics for an R/qtl cross object Usage
profileMark(cross, chr, stat.type = "marker", use.dist = TRUE,
          map.function = "kosambi", crit.val = NULL, display.markers = FALSE,
          mark.line = FALSE, ...)
Arguments
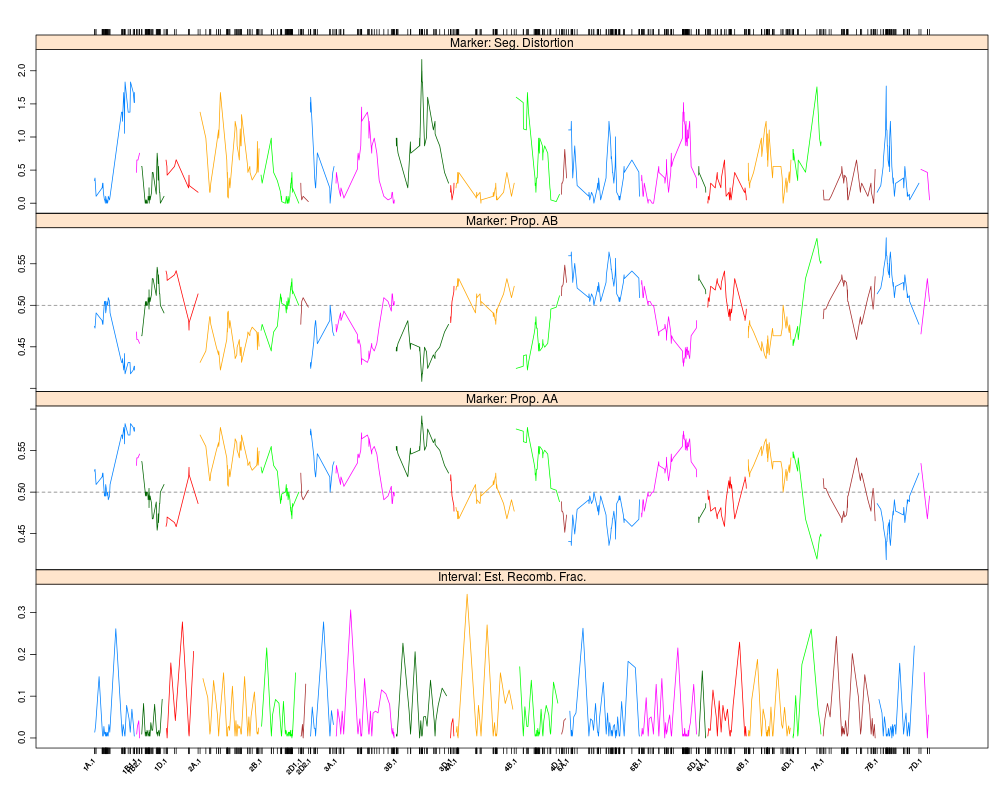
DetailsThis graphical function calls the function This function also allows users to choose any combination of marker or interval statistics they would like to view. The set of available marker statistics that can be profiled are given below
The set of available interval statistics that can be profiled are given below
If ValueA lattice panel plot is displayed with panels described by the
Author(s)Julian Taylor See Also
Examples
data(mapDH, package = "ASMap")

## profile chosen statistics

profileMark(mapDH, stat.type = c("seg.dist","prop","erf"), layout =
      c(1,4), type = "l")
Results
R version 3.3.1 (2016-06-21) -- "Bug in Your Hair"
Copyright (C) 2016 The R Foundation for Statistical Computing
Platform: x86_64-pc-linux-gnu (64-bit)

R is free software and comes with ABSOLUTELY NO WARRANTY.
You are welcome to redistribute it under certain conditions.
Type 'license()' or 'licence()' for distribution details.

R is a collaborative project with many contributors.
Type 'contributors()' for more information and
'citation()' on how to cite R or R packages in publications.

Type 'demo()' for some demos, 'help()' for on-line help, or
'help.start()' for an HTML browser interface to help.
Type 'q()' to quit R.

> library(ASMap)
Loading required package: qtl
Loading required package: gtools
Loading required package: fields
Loading required package: spam
Loading required package: grid
Spam version 1.3-0 (2015-10-24) is loaded.
Type 'help( Spam)' or 'demo( spam)' for a short introduction
and overview of this package.
Help for individual functions is also obtained by adding the
suffix '.spam' to the function name, e.g. 'help( chol.spam)'.

Attaching package: 'spam'

The following objects are masked from 'package:base':

    backsolve, forwardsolve

Loading required package: maps

 # maps v3.1: updated 'world': all lakes moved to separate new #
 # 'lakes' database. Type '?world' or 'news(package="maps")'.  #


Loading required package: RColorBrewer
Loading required package: lattice
> png(filename="/home/ddbj/snapshot/RGM3/R_CC/result/ASMap/profileMark.Rd_%03d_medium.png", width=480, height=480)
> ### Name: profileMark
> ### Title: Profile individual marker and interval statistics for an R/qtl
> ###   cross object
> ### Aliases: profileMark
> ### Keywords: misc
>
> ### ** Examples
>
>
> data(mapDH, package = "ASMap")
>
> ## profile chosen statistics
>
> profileMark(mapDH, stat.type = c("seg.dist","prop","erf"), layout =
+       c(1,4), type = "l")
Warning message:
In summary.cross(cross) :
  Some markers at the same position on chr 1B1,1D,2B,2D1,3A,3B,3D,4A,5A,5B,5D,6D,7A,7B,7D; use jittermap().
>
>
>
>
>
>
> dev.off()
null device
          1
>
|