Supported by Dr. Osamu Ogasawara and  . . |
|
Last data update: 2014.03.03 |
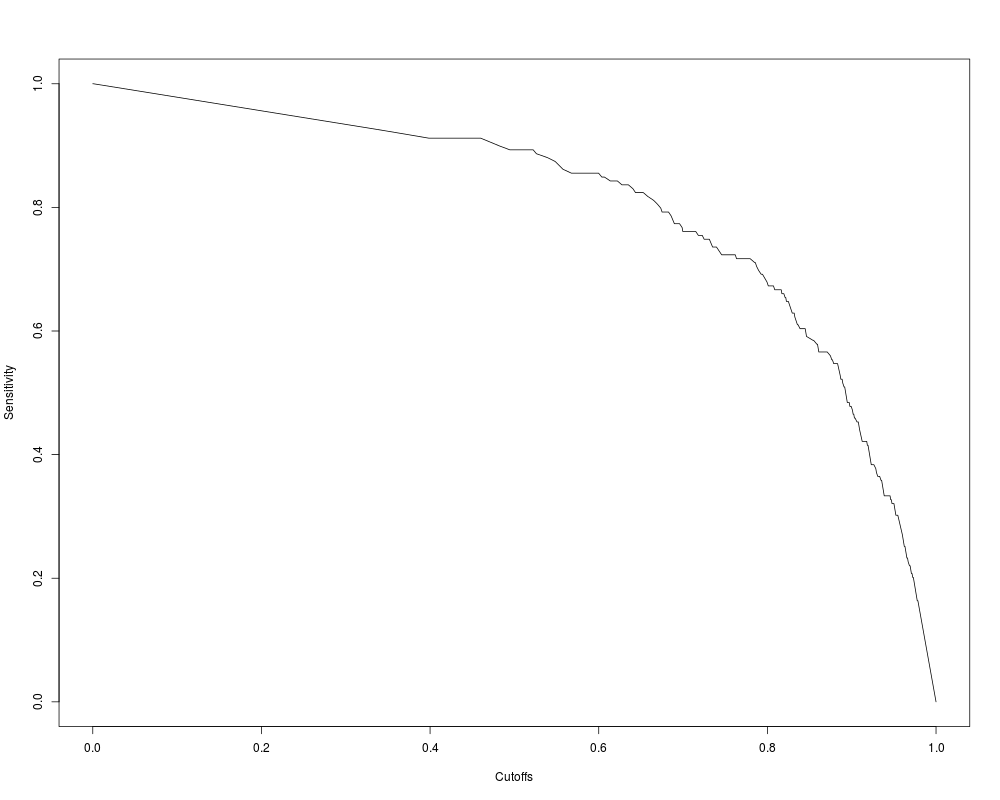
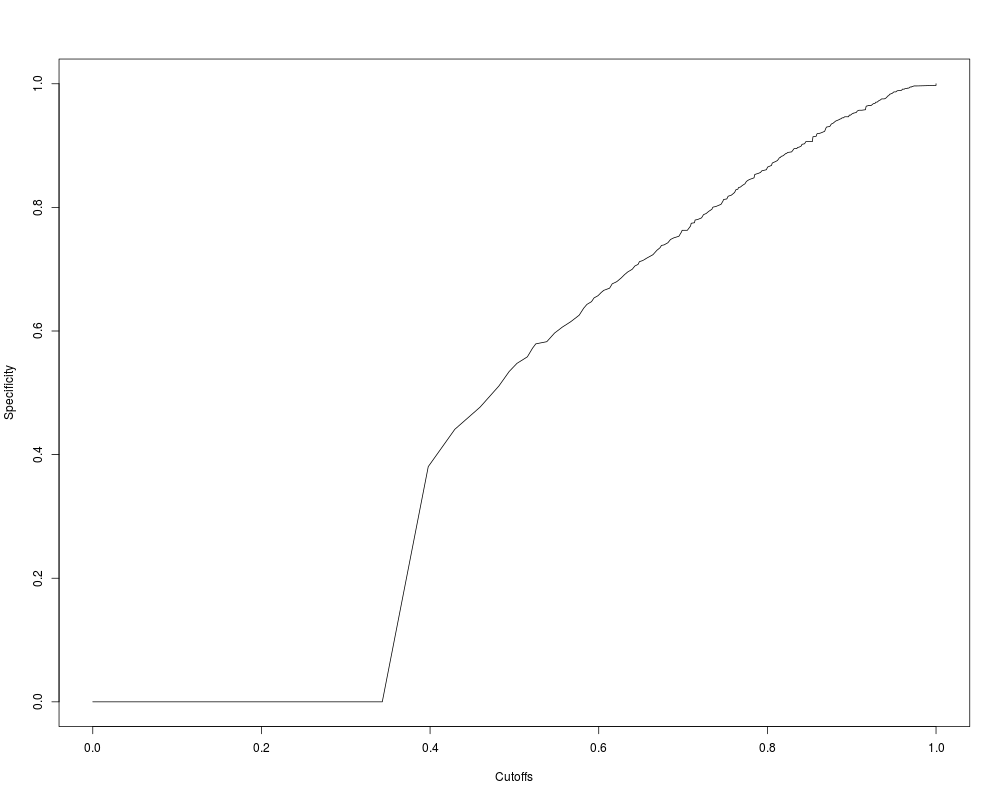
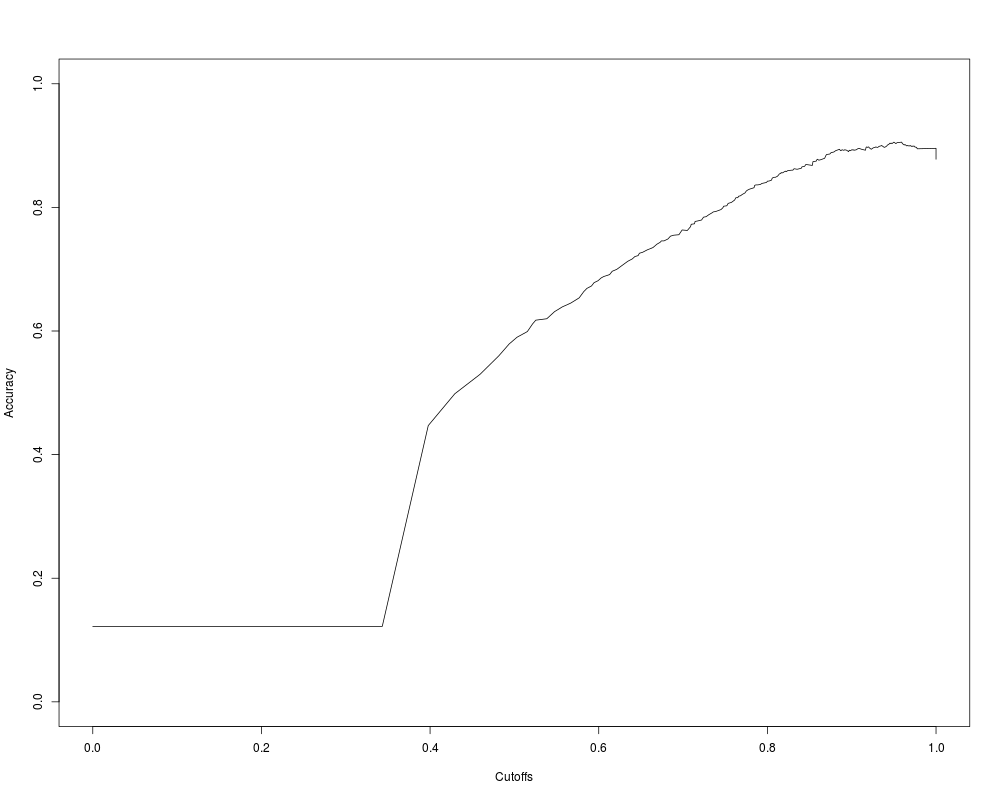
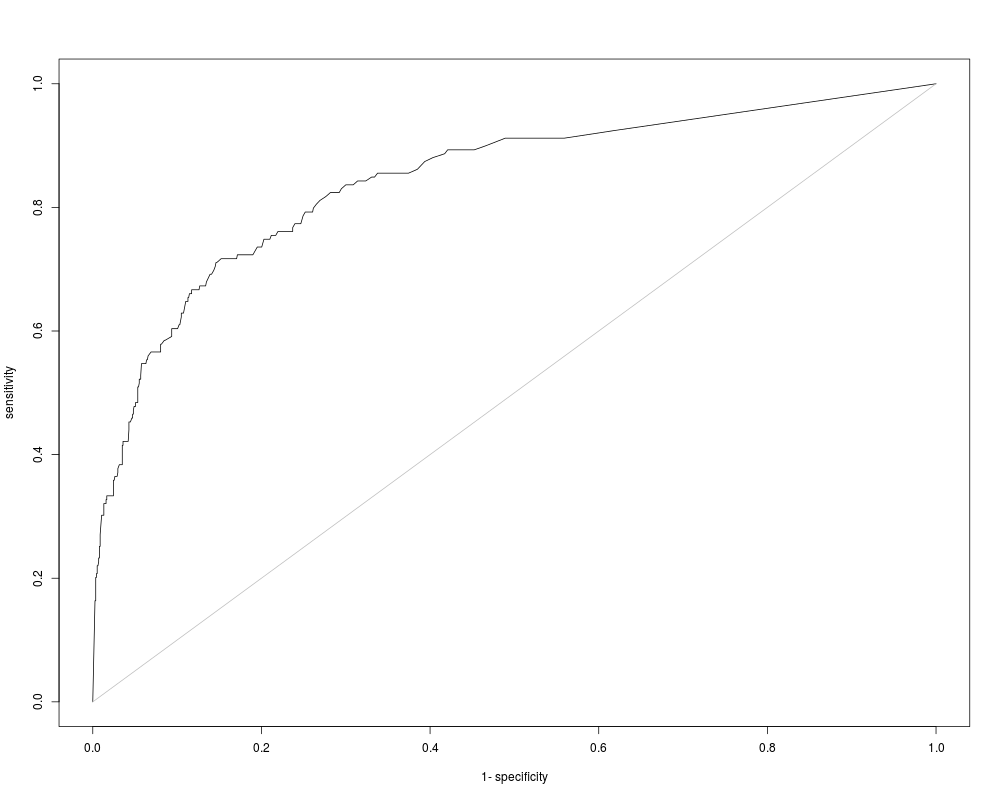
Plot the sensitivity, specificity, accuracy and roc curves.DescriptionThis function plots the (partial) sensitivity, specificity, accuracy and roc curves. Usage
  ## S3 method for class 'AUC'
 plot(x, y = NULL, ..., type = "l",
    add = FALSE, min = 0, max = 1)
Arguments
Author(s)Authors: Michel Ballings and Dirk Van den Poel, Maintainer: Michel.Ballings@UGent.be ReferencesBallings, M., Van den Poel, D., Threshold Independent Performance Measures for Probabilistic Classifcation Algorithms, Forthcoming. See Also
Examplesdata(churn) plot(sensitivity(churn$predictions,churn$labels)) plot(specificity(churn$predictions,churn$labels)) plot(accuracy(churn$predictions,churn$labels)) plot(roc(churn$predictions,churn$labels)) Results
R version 3.3.1 (2016-06-21) -- "Bug in Your Hair"
Copyright (C) 2016 The R Foundation for Statistical Computing
Platform: x86_64-pc-linux-gnu (64-bit)

R is free software and comes with ABSOLUTELY NO WARRANTY.
You are welcome to redistribute it under certain conditions.
Type 'license()' or 'licence()' for distribution details.

R is a collaborative project with many contributors.
Type 'contributors()' for more information and
'citation()' on how to cite R or R packages in publications.

Type 'demo()' for some demos, 'help()' for on-line help, or
'help.start()' for an HTML browser interface to help.
Type 'q()' to quit R.

> library(AUC)
AUC 0.3.0
Type AUCNews() to see the change log and ?AUC to get an overview.
> png(filename="/home/ddbj/snapshot/RGM3/R_CC/result/AUC/plot.AUC.Rd_%03d_medium.png", width=480, height=480)
> ### Name: plot.AUC
> ### Title: Plot the sensitivity, specificity, accuracy and roc curves.
> ### Aliases: plot.AUC
>
> ### ** Examples
>
> data(churn)
>
> plot(sensitivity(churn$predictions,churn$labels))
>
> plot(specificity(churn$predictions,churn$labels))
>
> plot(accuracy(churn$predictions,churn$labels))
>
> plot(roc(churn$predictions,churn$labels))
>
>
>
>
>
> dev.off()
null device
          1
>
|