  ## S3 method for class 'AUCRF'
plot(x, which=c("auc","ranking","psel"), showOpt=TRUE, digits=4,
       maxvars=NULL, ...)
Arguments
x
an object of class AUCRF as the result of AUCRF or AUCRFcv
functions.
which
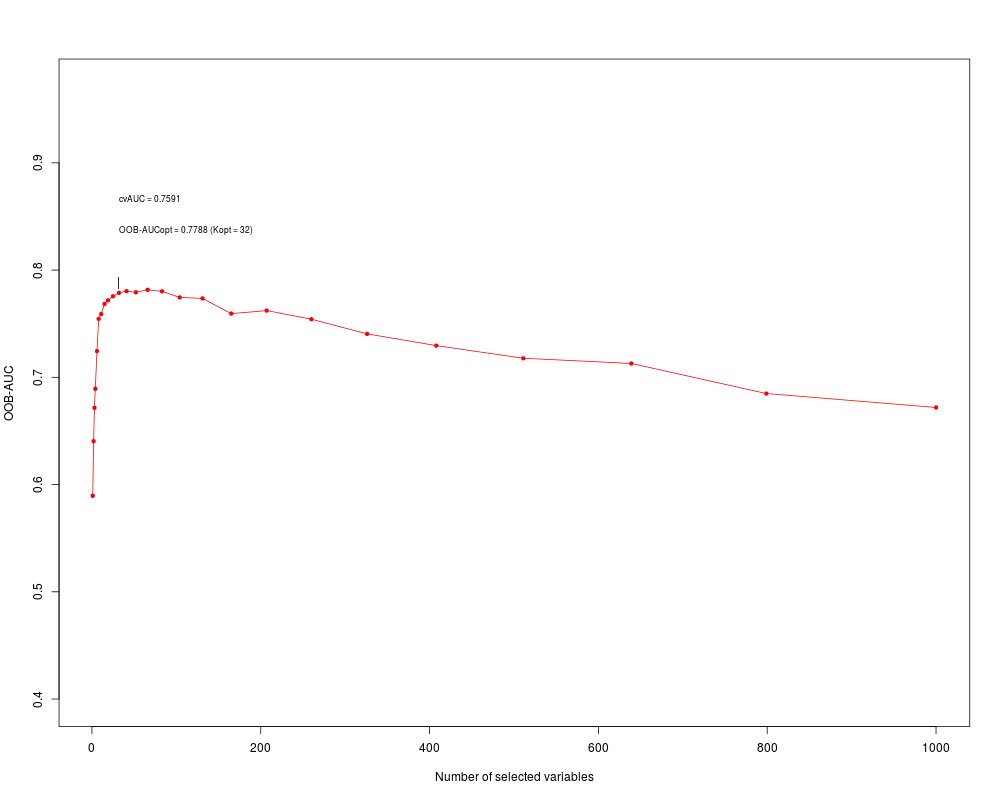
specifies the information to plot. There are three options: (1) "auc" (by default)
to plot the curve of AUCs in the backwards elimination process, (2) "ranking" to plot
the importance measure in initial ranking of each variable, and (3) "psel" to
plot the probability of selection of each variable. The "psel" option is only
available if a cross validation is performed by AUCRFcv function.
For option (1), showOpt and digits arguments can be specified for more details (see below).
For options (2) and (3), the number of variables to plot and their order preference can be
specified by maxvars and order arguments, respectively (see below).
showOpt
(only applied if "auc" option is specified in wich argument).
If showOpt=TRUE, the optimal subset is emphasised in the plot.
digits
(only applied if "auc" option is specified in wich argument and
showOpt or showThres are TRUE).
Specifies the number of decimal digits for representing the optimal AUC in the plot.
maxvars
(only applied if "ranking" or "psel" options are specified in wich argument).
Number of variables to include in the plot. The specified number of variables with highest importance measure
(initial ranking) will be plotted. If maxvars=NULL (by default) the selected variables will be plotted.
(For large number of variables, their names can be illegible in the plot)
...
other graphical parameters (see par).
Examples
  data(fitCV)

  # Plotting the AUC in the AUCRF backward elimination process:
  plot(fitCV)

  # Plotting the probability of selection of the selected variables:
  plot(fitCV, wich="psel")

  # Plotting the 20 variables with highest probability of selection:
  plot(fitCV, wich="psel", maxvars=20)
Results
R version 3.3.1 (2016-06-21) -- "Bug in Your Hair"
Copyright (C) 2016 The R Foundation for Statistical Computing
Platform: x86_64-pc-linux-gnu (64-bit)

R is free software and comes with ABSOLUTELY NO WARRANTY.
You are welcome to redistribute it under certain conditions.
Type 'license()' or 'licence()' for distribution details.

R is a collaborative project with many contributors.
Type 'contributors()' for more information and
'citation()' on how to cite R or R packages in publications.

Type 'demo()' for some demos, 'help()' for on-line help, or
'help.start()' for an HTML browser interface to help.
Type 'q()' to quit R.

> library(AUCRF)
Loading required package: randomForest
randomForest 4.6-12
Type rfNews() to see new features/changes/bug fixes.
AUCRF 1.1
> png(filename="/home/ddbj/snapshot/RGM3/R_CC/result/AUCRF/plot.AUCRF.Rd_%03d_medium.png", width=480, height=480)
> ### Name: plot.AUCRF
> ### Title: Plot Method for AUCRF
> ### Aliases: plot.AUCRF
>
> ### ** Examples
>
>   data(fitCV)
>
>   # Plotting the AUC in the AUCRF backward elimination process:
>   plot(fitCV)
>
>   # Plotting the probability of selection of the selected variables:
>   plot(fitCV, wich="psel")
>
>   # Plotting the 20 variables with highest probability of selection:
>   plot(fitCV, wich="psel", maxvars=20)
>
>
>
>
>
>
> dev.off()
null device
          1
>
 .
.