R: Plot Functional Linear Model Analysis Results of a...
cat_flm_plot
R Documentation
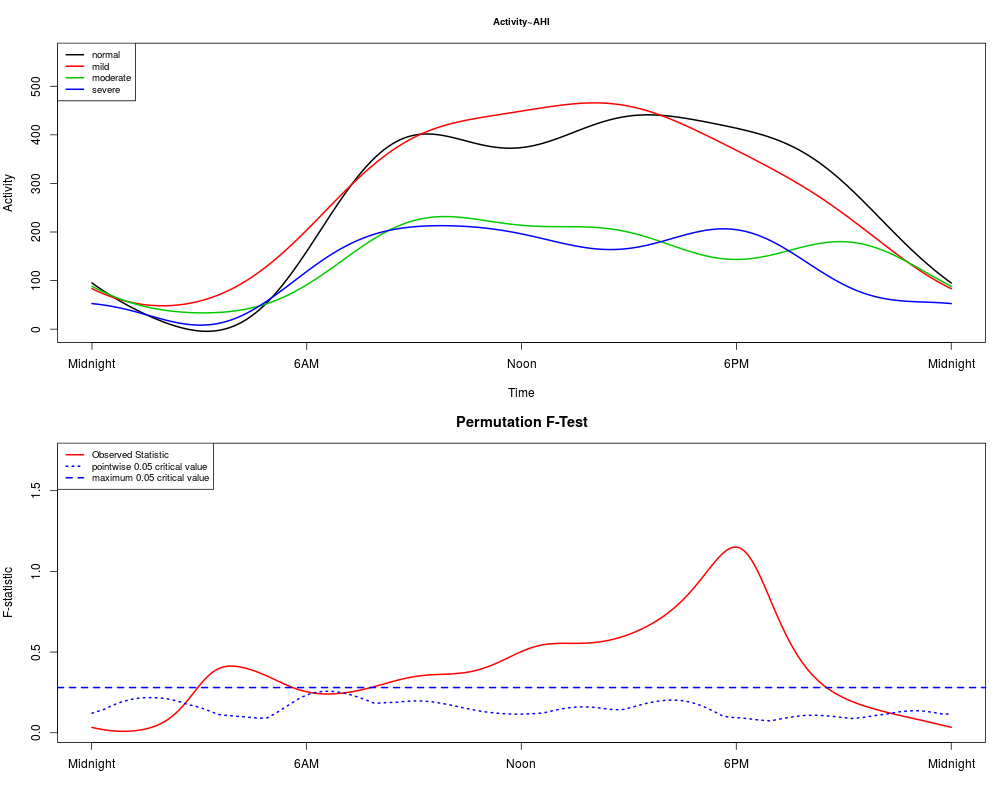
Plot Functional Linear Model Analysis Results of a Categorical Type
Description
This function produce either one or two plots: An effect of a categorical (factor) covariate on activity
values by time and potentially the F-test for the effect of the categorical covariate.
R version 3.3.1 (2016-06-21) -- "Bug in Your Hair"
Copyright (C) 2016 The R Foundation for Statistical Computing
Platform: x86_64-pc-linux-gnu (64-bit)

R is free software and comes with ABSOLUTELY NO WARRANTY.
You are welcome to redistribute it under certain conditions.
Type 'license()' or 'licence()' for distribution details.

R is a collaborative project with many contributors.
Type 'contributors()' for more information and
'citation()' on how to cite R or R packages in publications.

Type 'demo()' for some demos, 'help()' for on-line help, or
'help.start()' for an HTML browser interface to help.
Type 'q()' to quit R.

> library(Actigraphy)
Loading required package: fda
Loading required package: splines
Loading required package: Matrix

Attaching package: 'fda'

The following object is masked from 'package:graphics':

    matplot

> png(filename="/home/ddbj/snapshot/RGM3/R_CC/result/Actigraphy/cat_flm_plot.Rd_%03d_medium.png", width=480, height=480)
> ### Name: cat_flm_plot
> ### Title: Plot Functional Linear Model Analysis Results of a Categorical
> ###   Type
> ### Aliases: cat_flm_plot
>
> ### ** Examples
>
> 	data(act_29pt)
> 	data(clinic_29pt_ahi)
>
> 	colnames(act_29pt) <- sub("X", "", colnames(act_29pt))
> 	data <- as.matrix(act_29pt[,-1])
> 	ahi <- clinic_29pt_ahi
>
> 	ahi$ahicat <- as.factor(ifelse(ahi$AHI >= 0 & ahi$AHI <= 5, 1,
+ 					ifelse(ahi$AHI > 5 & ahi$AHI <= 15, 2,
+ 					ifelse(ahi$AHI > 15 & ahi$AHI <= 30, 3,
+ 					ifelse(ahi$AHI > 30, 4, 0)))))
>
> 	matchidb <- fda.matchid(data, ahi[,-2] , "factor",
+ 		c("normal", "mild", "moderate", "severe"))
> 	FDcatahi <- fda.smoothdata(matchidb)
>
> 	L <- nrow(data)
> 	lb <- c("Midnight", "6AM", "Noon", "6PM", "Midnight")
> 	xat <- c(0, L/4, L/2, 3*L/4, L)
>
> 	geftFDcatahi <- flm_cate(FDcatahi)
> 	predy <- as.vector(geftFDcatahi$freg$yhatfdobj$y)
>
> 	xlim <- c(0, L)
> 	ylim <- c(min(predy), max(predy) + 100)
>
> 	cat.flm.results <- cat_flm_plot(FDcatahi, matchidb, geftFDcatahi,
+ 		TRUE, 5, lb, xat, "AHI", 1:4, ylim, L)
[1] "Permutation F test running (5 permutations)"
[1] "Estimated Computing time = 1 seconds"
>
>
>
>
>
> dev.off()
null device
          1
>
 .
.