A list consisting of the following two components: data$mat A matrix where rows represent the time, columns are the samples, and the column names are the subjects. data$cov A two column matrix that contains the actigraphy data and clinical covariate.
basistype
A string specifying either "Fourier" and "bspline".
nbasis
The number of basis functions to be used for functional data. Default value is 9.
norder
The order of the bspline basis functions. Default value is 4.
Details
Note: The output of function fda.matchid can be directly used as the input for this argument.
If the data is a categorical covariate
Value
A list consisting of two components as follows:
fd
A fdSmooth data object containing the functional data (see function smooth.basis in the package fda for details).
cov
An object that is the same as the argument data$cov.
Author(s)
William D. Shannon, Tao Li, Hong Xian, Jia Wang, Elena Deych, Carlos Gonzalez
R version 3.3.1 (2016-06-21) -- "Bug in Your Hair"
Copyright (C) 2016 The R Foundation for Statistical Computing
Platform: x86_64-pc-linux-gnu (64-bit)
R is free software and comes with ABSOLUTELY NO WARRANTY.
You are welcome to redistribute it under certain conditions.
Type 'license()' or 'licence()' for distribution details.
R is a collaborative project with many contributors.
Type 'contributors()' for more information and
'citation()' on how to cite R or R packages in publications.
Type 'demo()' for some demos, 'help()' for on-line help, or
'help.start()' for an HTML browser interface to help.
Type 'q()' to quit R.
> library(Actigraphy)
Loading required package: fda
Loading required package: splines
Loading required package: Matrix
Attaching package: 'fda'
The following object is masked from 'package:graphics':
matplot
> png(filename="/home/ddbj/snapshot/RGM3/R_CC/result/Actigraphy/fda.smoothdata.Rd_%03d_medium.png", width=480, height=480)
> ### Name: fda.smoothdata
> ### Title: Functional Actigraphy Data Smoothing
> ### Aliases: fda.smoothdata
>
> ### ** Examples
>
> data(act_29pt)
> data(clinic_29pt_ahi)
>
> colnames(act_29pt) <- sub("X", "", colnames(act_29pt))
> data <- as.matrix(act_29pt[,-1])
>
> matchid <- fda.matchid(data, clinic_29pt_ahi, "contin")
> FDcont <- fda.smoothdata(matchid)
>
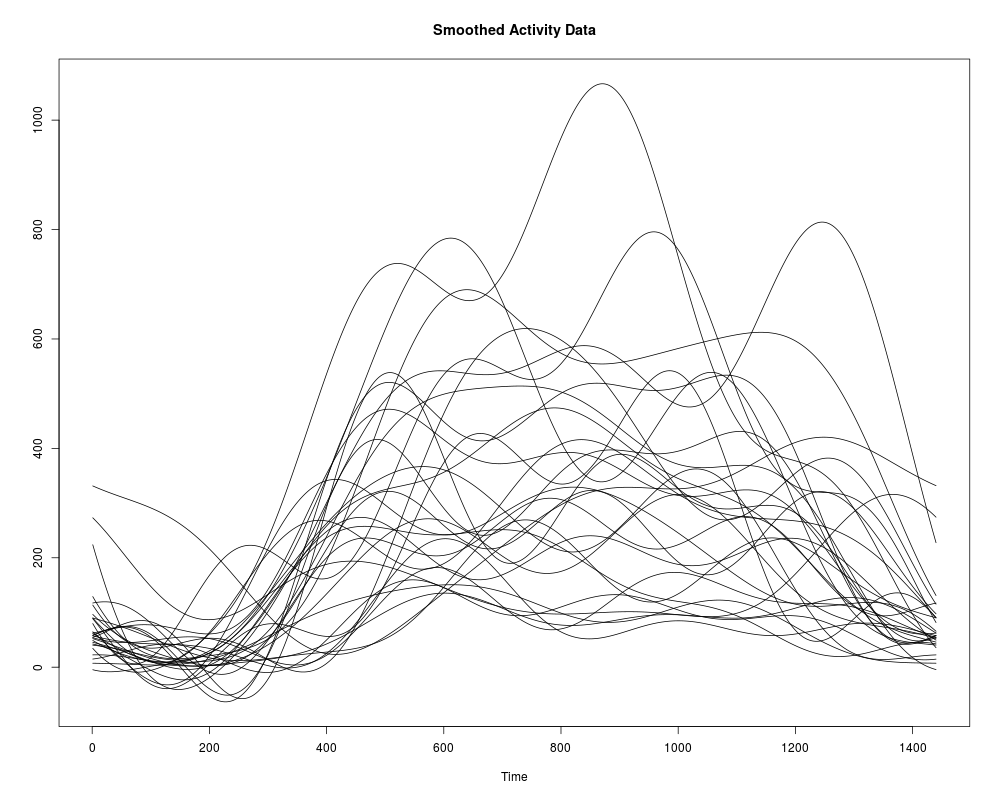
> ### Smooth the Results
> ts.plot(predict(FDcont$fd$fd, c(1:1440)), main="Smoothed Activity Data")
>
>
>
>
>
> dev.off()
null device
1
>
 .
.