Supported by Dr. Osamu Ogasawara and  . . |
|
Last data update: 2014.03.03 |
Mixture of Student-t DistributionsDescriptionDensity function or random generation for an adaptive mixture of Student-t distributions UsagedMit(theta, mit = list(), log = TRUE) rMit(N = 1, mit = list()) Arguments
Details
The argument
where H (>=1) is the number of components and
d (>=1) is
the dimension of the mixture approximation. Typically,
ValueVector (of length N of density values, or matrix (of size
NoteFurther details and examples of the R package Please cite the package in publications. Use Author(s)David Ardia ReferencesArdia, D., Hoogerheide, L.F., van Dijk, H.K. (2009a). AdMit: Adaptive Mixture of Student-t Distributions. The R Journal 1(1), pp.25–30. http://journal.r-project.org/2009-1/ Ardia, D., Hoogerheide, L.F., van Dijk, H.K. (2009b). Adaptive Mixture of Student-t Distributions as a Flexible Candidate Distribution for Efficient Simulation: The R Package AdMit. Journal of Statistical Software 29(3), pp.1–32. http://www.jstatsoft.org/v29/i03/ See Also
Examples
## NB : Low number of draws for speedup. Consider using more draws!
## One dimensional two components mixture of Student-t distributions
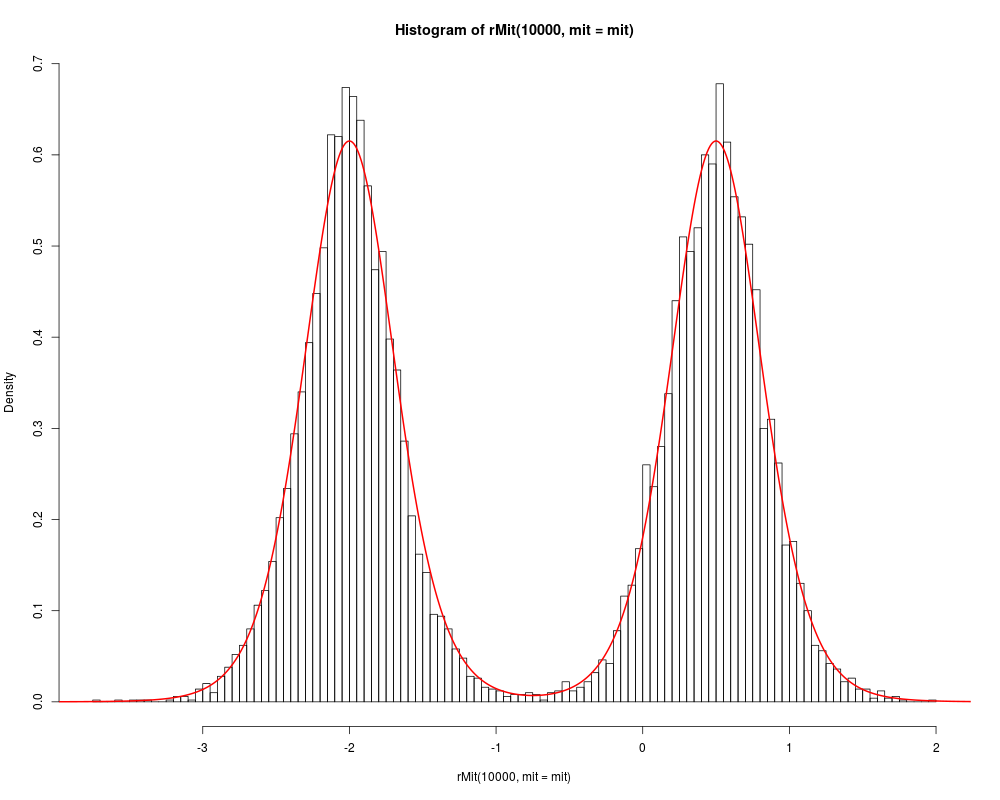
mit <- list(p = c(0.5, 0.5),
mu = matrix(c(-2.0, 0.5), 2, 1, byrow = TRUE),
Sigma = matrix(0.1, 2),
df = 10)
## Generate draws from the mixture
hist(rMit(1e4, mit = mit), nclass = 100, freq = FALSE)
x <- seq(from = -5.0, to = 5.0, by = 0.01)
## Add the density to the histogram
lines(x, dMit(x, mit = mit, log = FALSE), col = "red", lwd = 2)
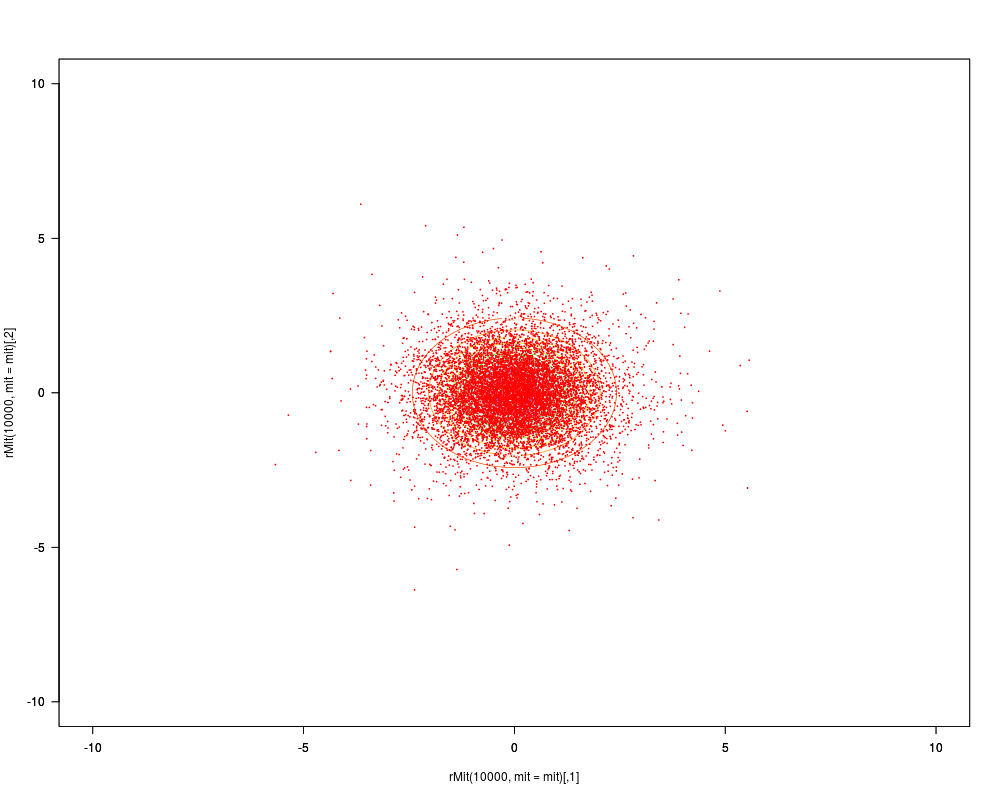
## Two dimensional (one component mixture) Student-t distribution
mit <- list(p = 1,
mu = matrix(0.0, 1.0, 2.0),
Sigma = matrix(c(1.0, 0.0, 0.0, 1.0), 1, 4),
df = 10)
## Function used to plot the mixture in two dimensions
dMitPlot <- function(x1, x2, mit = mit)
{
dMit(cbind(x1, x2), mit = mit, log = FALSE)
}
x1 <- x2 <- seq(from = -10.0, to = 10.0, by = 0.1)
thexlim <- theylim <- range(x1)
z <- outer(x1, x2, FUN = dMitPlot, mit = mit)
## Contour plot of the mixture
contour(x1, x2, z, nlevel = 20, las = 1,
col = rainbow(20),
xlim = thexlim, ylim = theylim)
par(new = TRUE)
## Generate draws from the mixture
plot(rMit(1e4, mit = mit), pch = 20, cex = 0.3,
xlim = thexlim, ylim = theylim, col = "red", las = 1)
Results
R version 3.3.1 (2016-06-21) -- "Bug in Your Hair"
Copyright (C) 2016 The R Foundation for Statistical Computing
Platform: x86_64-pc-linux-gnu (64-bit)

R is free software and comes with ABSOLUTELY NO WARRANTY.
You are welcome to redistribute it under certain conditions.
Type 'license()' or 'licence()' for distribution details.

R is a collaborative project with many contributors.
Type 'contributors()' for more information and
'citation()' on how to cite R or R packages in publications.

Type 'demo()' for some demos, 'help()' for on-line help, or
'help.start()' for an HTML browser interface to help.
Type 'q()' to quit R.

> library(AdMit)
Loading required package: mvtnorm
> png(filename="/home/ddbj/snapshot/RGM3/R_CC/result/AdMit/Mit.Rd_%03d_medium.png", width=480, height=480)
> ### Name: Mit
> ### Title: Mixture of Student-t Distributions
> ### Aliases: dMit rMit
> ### Keywords: distribution
>
> ### ** Examples
>
>   ## NB : Low number of draws for speedup. Consider using more draws!
>   ## One dimensional two components mixture of Student-t distributions
>   mit <- list(p = c(0.5, 0.5),
+               mu = matrix(c(-2.0, 0.5), 2, 1, byrow = TRUE),
+               Sigma = matrix(0.1, 2),
+               df = 10)
>   ## Generate draws from the mixture
>   hist(rMit(1e4, mit = mit), nclass = 100, freq = FALSE)
>   x <- seq(from = -5.0, to = 5.0, by = 0.01)
>   ## Add the density to the histogram
>   lines(x, dMit(x, mit = mit, log = FALSE), col = "red", lwd = 2)
>
>   ## Two dimensional (one component mixture) Student-t distribution
>   mit <- list(p = 1,
+               mu = matrix(0.0, 1.0, 2.0),
+               Sigma = matrix(c(1.0, 0.0, 0.0, 1.0), 1, 4),
+               df = 10)
>   ## Function used to plot the mixture in two dimensions
>   dMitPlot <- function(x1, x2, mit = mit)
+   {
+     dMit(cbind(x1, x2), mit = mit, log = FALSE)
+   }
>   x1 <- x2 <- seq(from = -10.0, to = 10.0, by = 0.1)
>   thexlim <- theylim <- range(x1)
>   z <- outer(x1, x2, FUN = dMitPlot, mit = mit)
>   ## Contour plot of the mixture
>   contour(x1, x2, z, nlevel = 20, las = 1,
+           col = rainbow(20),
+           xlim = thexlim, ylim = theylim)
>   par(new = TRUE)
>   ## Generate draws from the mixture
>   plot(rMit(1e4, mit = mit), pch = 20, cex = 0.3,
+             xlim = thexlim, ylim = theylim, col = "red", las = 1)
>
>
>
>
>
>
> dev.off()
null device
          1
>
|