Supported by Dr. Osamu Ogasawara and  . . |
|
Last data update: 2014.03.03 |
Pairwise scatter plots of the survival timesDescriptionThis function generates pairwise scatter plots. UsageplotObsEst(yObs, yEst, delta, xlab = NULL, ylab = NULL, title = NULL, legendplot = TRUE, legendpos = "topleft", maxvalue = NULL, minvalue = NULL) Arguments
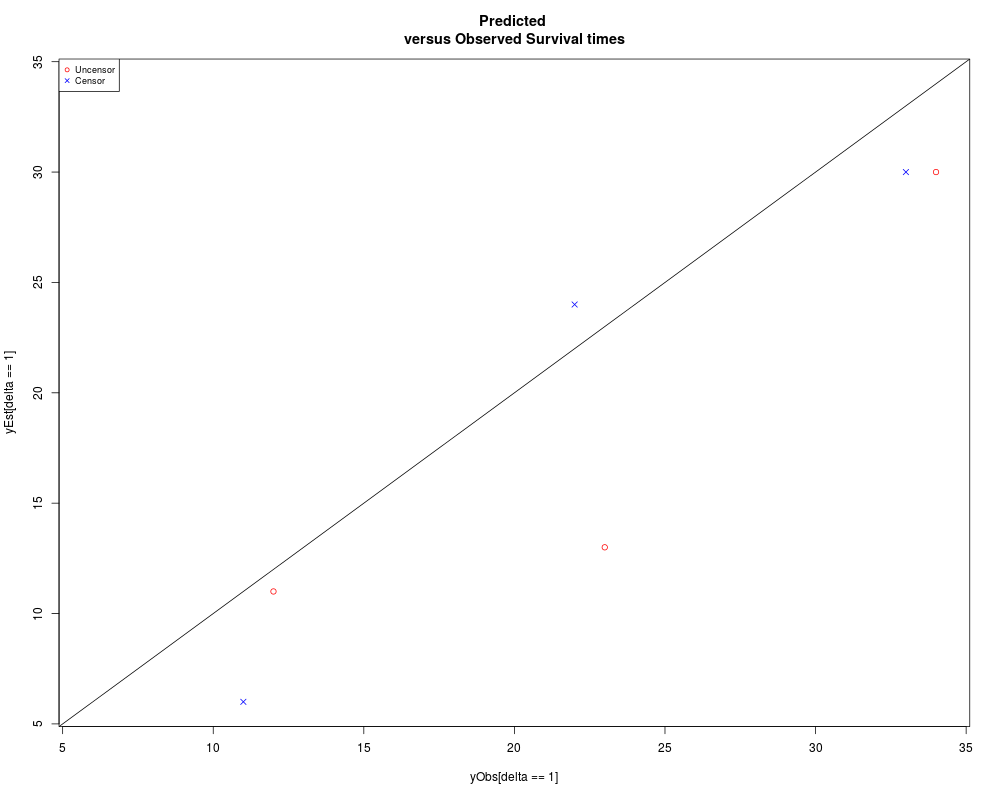
DetailsThis function generates pairwise scatter plots of the observed and predicted survival times. ValueThis provides a scatter plot of the survival times. ReferencesKhan and Shaw (2015). Variable Selection for Survival Data with a Class of Adaptive Elastic Net Techniques. Statistics and Computing (published online; DOI: 10.1007/s11222-015-9555-8). Also available in http://arxiv.org/abs/1312.2079. Examples#For a hypothetical data y<-c(12,33,22,34,11,23) delta<-c(1,0,0,1,0,1) yEst<-c(11,30,24,30,6,13) #plotObsEst: scatter plotting of the pairwise survival times plot<-plotObsEst(y, yEst, delta, xlab = NULL, ylab = NULL, title = "Predicted versus Observed Survival times", legendplot = TRUE, legendpos = "topleft", maxvalue = NULL, minvalue = NULL) Results
R version 3.3.1 (2016-06-21) -- "Bug in Your Hair"
Copyright (C) 2016 The R Foundation for Statistical Computing
Platform: x86_64-pc-linux-gnu (64-bit)

R is free software and comes with ABSOLUTELY NO WARRANTY.
You are welcome to redistribute it under certain conditions.
Type 'license()' or 'licence()' for distribution details.

R is a collaborative project with many contributors.
Type 'contributors()' for more information and
'citation()' on how to cite R or R packages in publications.

Type 'demo()' for some demos, 'help()' for on-line help, or
'help.start()' for an HTML browser interface to help.
Type 'q()' to quit R.

> library(AdapEnetClass)
Loading required package: imputeYn
Loading required package: quadprog
Loading required package: emplik
Loading required package: quantreg
Loading required package: SparseM

Attaching package: 'SparseM'

The following object is masked from 'package:base':

    backsolve

Loading required package: mvtnorm
Loading required package: survival

Attaching package: 'survival'

The following object is masked from 'package:quantreg':

    untangle.specials

Loading required package: boot

Attaching package: 'boot'

The following object is masked from 'package:survival':

    aml


Attaching package: 'imputeYn'

The following object is masked from 'package:utils':

    data

Loading required package: glmnet
Loading required package: Matrix
Loading required package: foreach
Loaded glmnet 2.0-5

Loading required package: lars
Loaded lars 1.2

> png(filename="/home/ddbj/snapshot/RGM3/R_CC/result/AdapEnetClass/plotObsEst.Rd_%03d_medium.png", width=480, height=480)
> ### Name: plotObsEst
> ### Title: Pairwise scatter plots of the survival times
> ### Aliases: plotObsEst
>
> ### ** Examples
>
> #For a hypothetical data
> y<-c(12,33,22,34,11,23)
> delta<-c(1,0,0,1,0,1)
> yEst<-c(11,30,24,30,6,13)
>
> #plotObsEst: scatter plotting of the pairwise survival times
> ## No test:
> plot<-plotObsEst(y, yEst, delta, xlab = NULL, ylab = NULL, title = "Predicted
+ versus Observed Survival times", legendplot = TRUE, legendpos = "topleft",
+ maxvalue = NULL, minvalue = NULL)
> ## End(No test)
>
>
>
>
>
> dev.off()
null device
          1
>
|