Supported by Dr. Osamu Ogasawara and  . . |
|
Last data update: 2014.03.03 |
Semiparametric regression prediction.DescriptionTakes a fitted Usage## S3 method for class 'asp' predict(object,newdata,se,...) Arguments
DetailsTakes a fitted ValueIf se=FALSE then a vector of predictions at ‘newdata’ is returned. If se=TRUE then a list with components named ‘fit’ and ‘se’ is returned. The ‘fit’ component contains the predictions. The ‘se’ component contains standard error estimates. Author(s)Manuel Wiesenfarth, based on implementation of M.P. Wand (package See Also
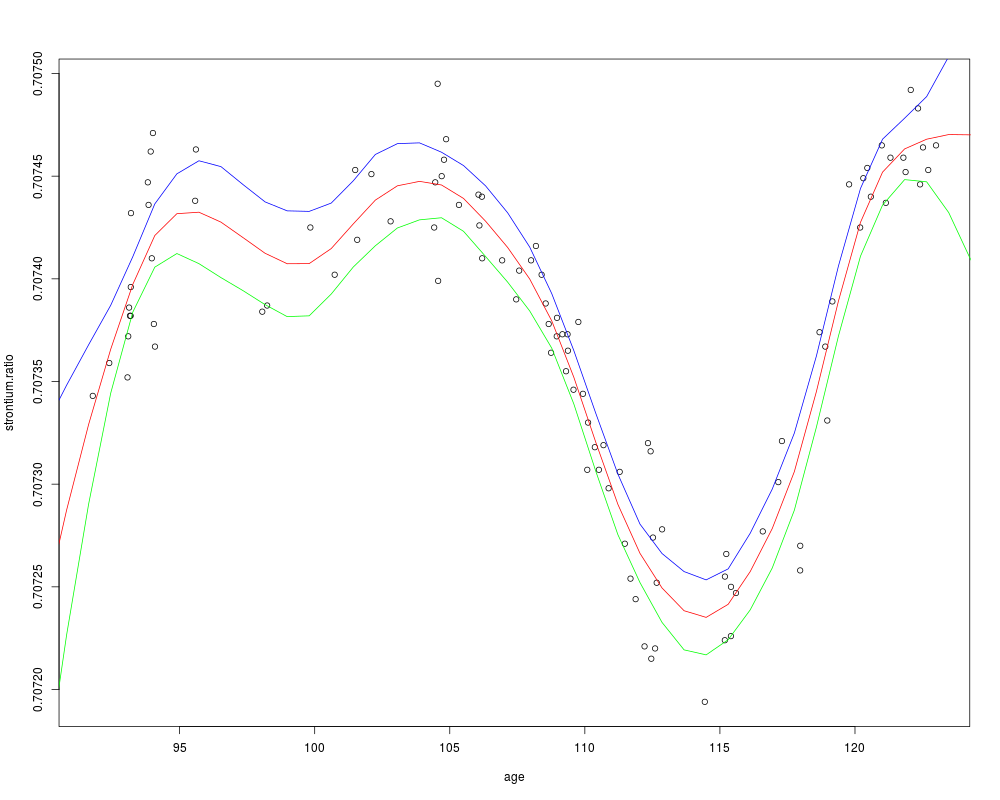
Exampleslibrary(SemiPar) data(fossil) attach(fossil) fit <- asp2(strontium.ratio~f(age, basis="tps")) newdata.age <- data.frame(age=c(90,100,110,120,130)) preds <- predict(fit,newdata=newdata.age,se=TRUE) print(preds) # Use predict to avoid centering of smooths in case of scatterplot # smoothing fit <- asp2(strontium.ratio~f(age,basis="tps")) newdata.age <-data.frame(age=seq(90,130,length.out=50) ) preds <- predict(fit,newdata=newdata.age,se=TRUE) plot(age,strontium.ratio) lines(newdata.age$age,preds$fit,col="red") lines(unlist(newdata.age),preds$fit+2*preds$se,col="blue") lines(unlist(newdata.age),preds$fit-2*preds$se,col="green") Results
R version 3.3.1 (2016-06-21) -- "Bug in Your Hair"
Copyright (C) 2016 The R Foundation for Statistical Computing
Platform: x86_64-pc-linux-gnu (64-bit)

R is free software and comes with ABSOLUTELY NO WARRANTY.
You are welcome to redistribute it under certain conditions.
Type 'license()' or 'licence()' for distribution details.

R is a collaborative project with many contributors.
Type 'contributors()' for more information and
'citation()' on how to cite R or R packages in publications.

Type 'demo()' for some demos, 'help()' for on-line help, or
'help.start()' for an HTML browser interface to help.
Type 'q()' to quit R.

> library(AdaptFitOS)
Loading required package: nlme
Loading required package: MASS
Loading required package: splines

AdaptFitOS 0.62 loaded. Type 'help("AdaptFitOS-package")' for an overview.

Please cite as:
   Wiesenfarth, M., Krivobokova, T., Klasen, S., & Sperlich, S. (2012).
   Direct simultaneous inference in additive models and its application to model undernutrition.
   Journal of the American Statistical Association, 107(500), 1286-1296.

Attaching package: 'AdaptFitOS'

The following object is masked from 'package:stats':

    sigma

> png(filename="/home/ddbj/snapshot/RGM3/R_CC/result/AdaptFitOS/predict.asp.Rd_%03d_medium.png", width=480, height=480)
> ### Name: predict.asp
> ### Title: Semiparametric regression prediction.
> ### Aliases: predict.asp
> ### Keywords: models smooth regression
>
> ### ** Examples
>
> library(SemiPar)

Attaching package: 'SemiPar'

The following object is masked from 'package:AdaptFitOS':

    default.knots

> data(fossil)
> attach(fossil)
> fit <- asp2(strontium.ratio~f(age, basis="tps"))
> newdata.age <- data.frame(age=c(90,100,110,120,130))
> preds <-  predict(fit,newdata=newdata.age,se=TRUE)
> print(preds)
$fit
[1] 0.7072402 0.7074085 0.7073363 0.7074190 0.7073855

$se
[1] 4.352894e-05 1.241325e-05 6.764931e-06 8.208830e-06 1.818757e-04

>
> # Use predict to avoid centering of smooths in case of scatterplot
> # smoothing
>   fit <- asp2(strontium.ratio~f(age,basis="tps"))
>   newdata.age <-data.frame(age=seq(90,130,length.out=50) )
>   preds <- predict(fit,newdata=newdata.age,se=TRUE)
>   plot(age,strontium.ratio)
>   lines(newdata.age$age,preds$fit,col="red")
>   lines(unlist(newdata.age),preds$fit+2*preds$se,col="blue")
>   lines(unlist(newdata.age),preds$fit-2*preds$se,col="green")
>
>
>
>
>
> dev.off()
null device
          1
>
|