Supported by Dr. Osamu Ogasawara and  . . |
|
Last data update: 2014.03.03 |
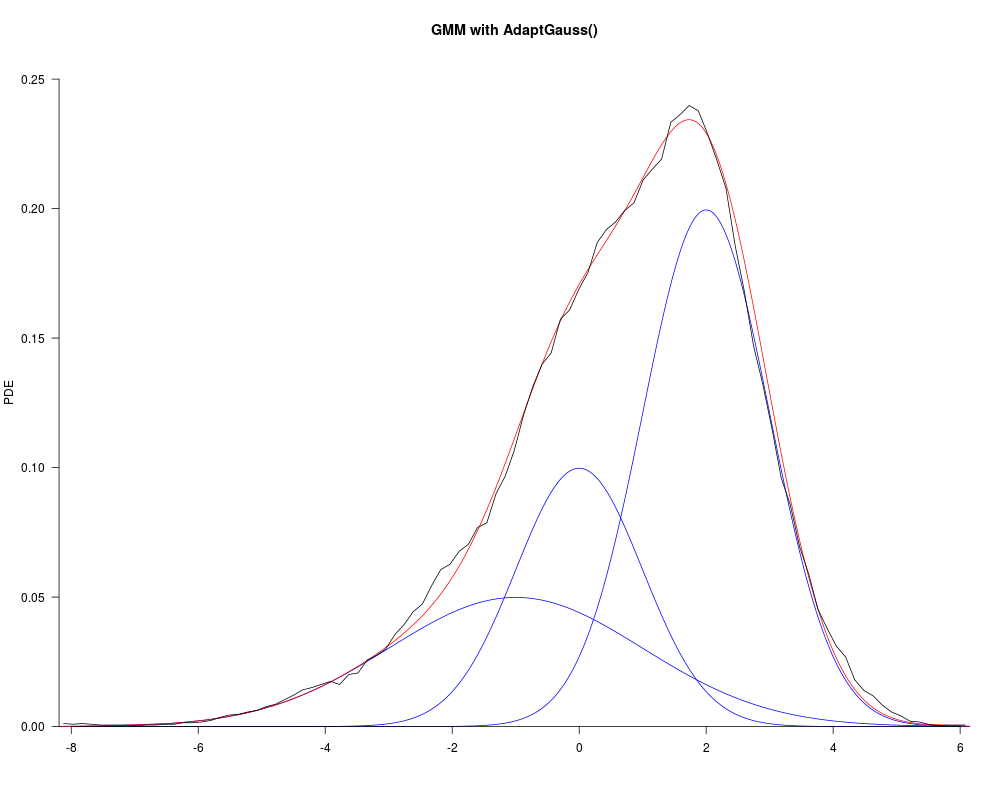
Shows GMMDescriptionPlots Gaussian Mixture Model without Bayes decision boundaries, such that: Black is the PDE of Data Red is color of the GMM Blue is the color of components of the mixture UsagePlotMixtures(Data, Means, SDs, Weights,IsLogDistribution, SingleColor, MixtureColor,DataColor, SingleGausses,axes, xlab, ylab,xlim, ylim, ...) Arguments
Author(s)Michael Thrun See Also
Examplesdata=c(rnorm(1000),rnorm(2000)+2,rnorm(1000)*2-1) PlotMixtures(data,c(-1,0,2),c(2,1,1),c(0.25,0.25,0.5),SingleColor='blue',SingleGausses=TRUE) Results
R version 3.3.1 (2016-06-21) -- "Bug in Your Hair"
Copyright (C) 2016 The R Foundation for Statistical Computing
Platform: x86_64-pc-linux-gnu (64-bit)

R is free software and comes with ABSOLUTELY NO WARRANTY.
You are welcome to redistribute it under certain conditions.
Type 'license()' or 'licence()' for distribution details.

R is a collaborative project with many contributors.
Type 'contributors()' for more information and
'citation()' on how to cite R or R packages in publications.

Type 'demo()' for some demos, 'help()' for on-line help, or
'help.start()' for an HTML browser interface to help.
Type 'q()' to quit R.

> library(AdaptGauss)
> png(filename="/home/ddbj/snapshot/RGM3/R_CC/result/AdaptGauss/PlotMixtures.Rd_%03d_medium.png", width=480, height=480)
> ### Name: PlotMixtures
> ### Title: Shows GMM
> ### Aliases: PlotMixtures
> ### Keywords: GMM gaussian mixture model
>
> ### ** Examples
>
> data=c(rnorm(1000),rnorm(2000)+2,rnorm(1000)*2-1)
> PlotMixtures(data,c(-1,0,2),c(2,1,1),c(0.25,0.25,0.5),SingleColor='blue',SingleGausses=TRUE)
>
>
>
>
>
> dev.off()
null device
          1
>
|