Supported by Dr. Osamu Ogasawara and  . . |
|
Last data update: 2014.03.03 |
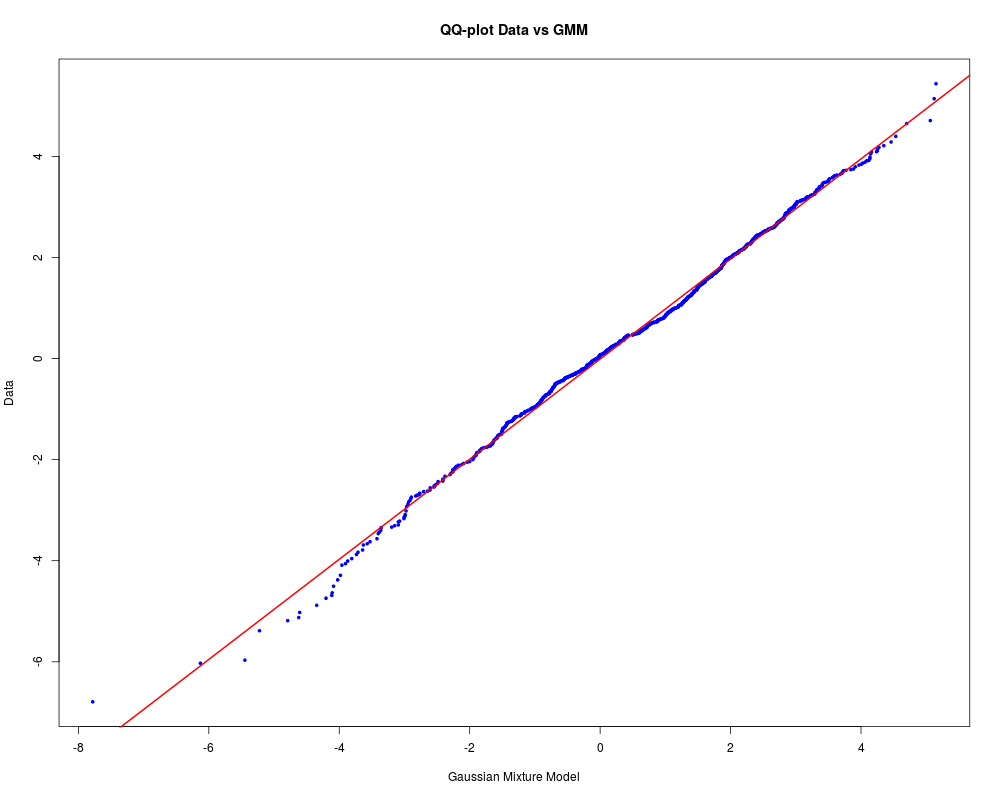
Quantile Quantile Plot of DataDescriptionQuantile Quantile plot of data against gaussian distribution mixture model with optional best-fit-line UsageQQplotGMM(Data,Means,SDs,Weights,IsLogDistribution,Line, PlotSymbol,xug,xog,LineWidth,PointWidth, ylab,main, ...) Arguments
DetailsOnly verified for a Gaussian Mixture Model, usage of IsLogDistribution for LogNormal Modes is experimental! ValueList with
Author(s)Michael Thrun ReferencesMichael, J. R. (1983). The stabilized probability plot. Biometrika, 70(1), 11-17. See Also
Examplesdata=c(rnorm(1000),rnorm(2000)+2,rnorm(1000)*2-1) QQplotGMM(data,c(-1,0,2),c(2,1,1),c(0.25,0.25,0.5)) Results
R version 3.3.1 (2016-06-21) -- "Bug in Your Hair"
Copyright (C) 2016 The R Foundation for Statistical Computing
Platform: x86_64-pc-linux-gnu (64-bit)

R is free software and comes with ABSOLUTELY NO WARRANTY.
You are welcome to redistribute it under certain conditions.
Type 'license()' or 'licence()' for distribution details.

R is a collaborative project with many contributors.
Type 'contributors()' for more information and
'citation()' on how to cite R or R packages in publications.

Type 'demo()' for some demos, 'help()' for on-line help, or
'help.start()' for an HTML browser interface to help.
Type 'q()' to quit R.

> library(AdaptGauss)
> png(filename="/home/ddbj/snapshot/RGM3/R_CC/result/AdaptGauss/qqplotGMM.Rd_%03d_medium.png", width=480, height=480)
> ### Name: QQplotGMM
> ### Title: Quantile Quantile Plot of Data
> ### Aliases: QQplotGMM
> ### Keywords: plot qqplot qq-plot quantile/quantile-plot best-fit-line
>
> ### ** Examples
>
> data=c(rnorm(1000),rnorm(2000)+2,rnorm(1000)*2-1)
> QQplotGMM(data,c(-1,0,2),c(2,1,1),c(0.25,0.25,0.5))
>
>
>
>
>
>
> dev.off()
null device
          1
>
|