an object of type "pairwise alignment comparison" (typically the summary file generated by compare_alignments)
scale
scale data to proportion of characters that are not conserved gaps (default = TRUE)
stack
stacked area plot in stead of line plot (deault = TRUE)
display
display this plot (default = TRUE)
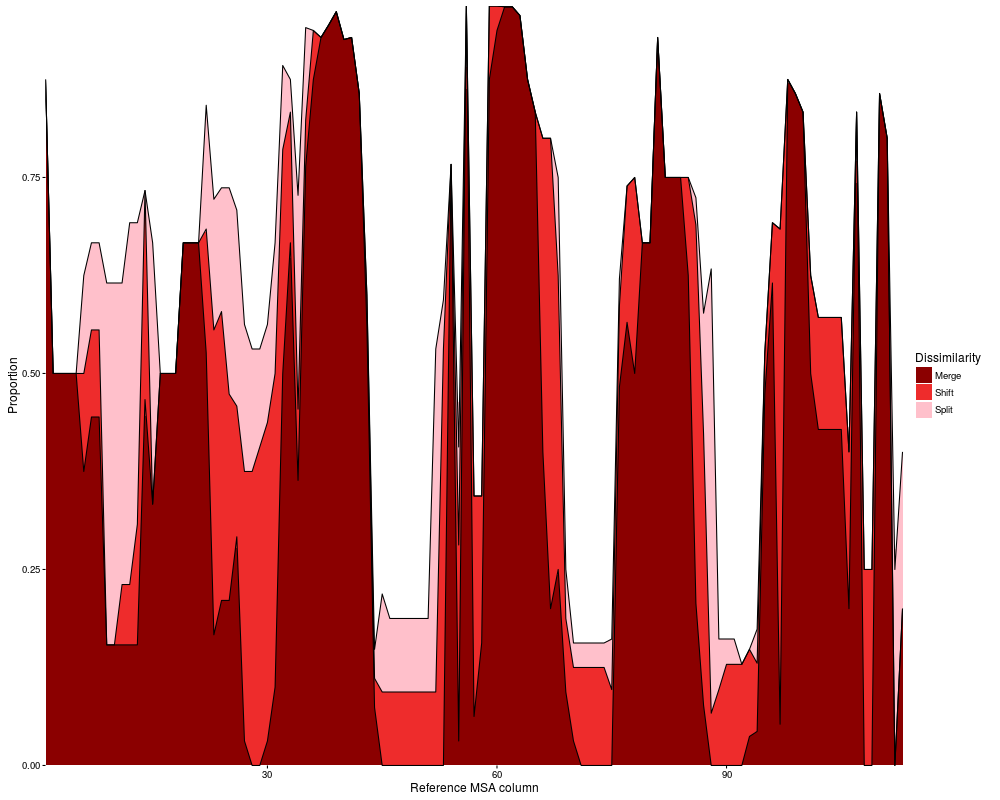
Note
This function generates a detailed breakdown of the differences between the multiple sequence alignments for each column of the reference alignment. For each column, the relative proportions of merges, splits and shifts is plotted as a proportion of characters that are not merely conserved gaps.
R version 3.3.1 (2016-06-21) -- "Bug in Your Hair"
Copyright (C) 2016 The R Foundation for Statistical Computing
Platform: x86_64-pc-linux-gnu (64-bit)

R is free software and comes with ABSOLUTELY NO WARRANTY.
You are welcome to redistribute it under certain conditions.
Type 'license()' or 'licence()' for distribution details.

R is a collaborative project with many contributors.
Type 'contributors()' for more information and
'citation()' on how to cite R or R packages in publications.

Type 'demo()' for some demos, 'help()' for on-line help, or
'help.start()' for an HTML browser interface to help.
Type 'q()' to quit R.

> library(AlignStat)
> png(filename="/home/ddbj/snapshot/RGM3/R_CC/result/AlignStat/plot_dissimilarity_summary.Rd_%03d_medium.png", width=480, height=480)
> ### Name: plot_dissimilarity_summary
> ### Title: An area plot summary of the different causes of column
> ###   dissimilarity between two multiple sequence alignments
> ### Aliases: plot_dissimilarity_summary
>
> ### ** Examples
>
> data(reference_alignment)
> data(comparison_alignment)
> PAC <- compare_alignments(reference_alignment,comparison_alignment)
> plot_dissimilarity_summary(PAC, stack=TRUE)
>
>
>
>
>
>
> dev.off()
null device
          1
>
 .
.