an object of type "pairwise alignment comparison" (typically the summary file generated by compare_alignments)
scale
scale data to proportion of characters that are not conserved gaps (default = TRUE)
display
display this plot (default = TRUE)
Note
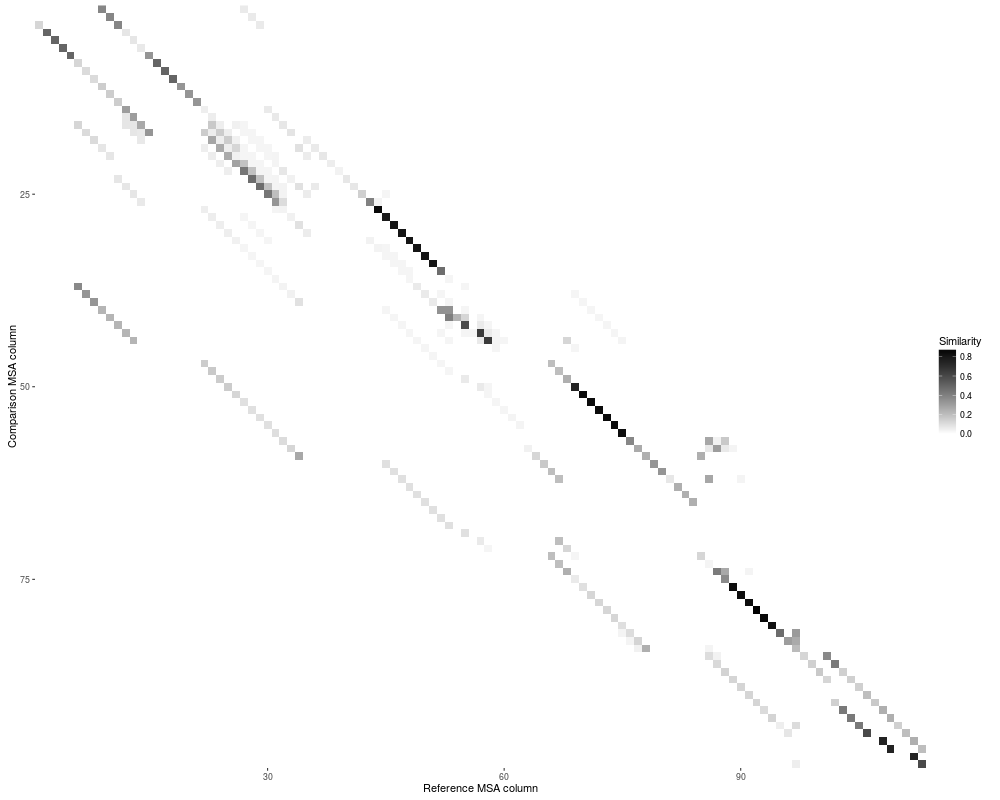
This function displays the similarity between each pairwise column comparison for the reference and comparison MSAs. Colour density is determined by the proportion of identical character matches between the columns, normalised to the number of characters that are not merely conserved gaps. This gives a representation of which columns are well agreed upon by the MSAs, and which columns are split by one MSA relative to the other.
R version 3.3.1 (2016-06-21) -- "Bug in Your Hair"
Copyright (C) 2016 The R Foundation for Statistical Computing
Platform: x86_64-pc-linux-gnu (64-bit)

R is free software and comes with ABSOLUTELY NO WARRANTY.
You are welcome to redistribute it under certain conditions.
Type 'license()' or 'licence()' for distribution details.

R is a collaborative project with many contributors.
Type 'contributors()' for more information and
'citation()' on how to cite R or R packages in publications.

Type 'demo()' for some demos, 'help()' for on-line help, or
'help.start()' for an HTML browser interface to help.
Type 'q()' to quit R.

> library(AlignStat)
> png(filename="/home/ddbj/snapshot/RGM3/R_CC/result/AlignStat/plot_similarity_heatmap.Rd_%03d_medium.png", width=480, height=480)
> ### Name: plot_similarity_heatmap
> ### Title: A heatmap plot of the column identities between two multiple
> ###   sequence alignments
> ### Aliases: plot_similarity_heatmap
>
> ### ** Examples
>
> data(reference_alignment)
> data(comparison_alignment)
> PAC <- compare_alignments(reference_alignment,comparison_alignment)
> plot_similarity_heatmap(PAC)
>
>
>
>
>
>
> dev.off()
null device
          1
>
 .
.