Supported by Dr. Osamu Ogasawara and  . . |
|
Last data update: 2014.03.03 |
Statistical Analysis Of Amplicon Data Of The Same Sample To Identify ArtefactsDescriptionIncreasingly powerful techniques for high-throughput sequencing open the possibility to comprehensively characterize microbial communities, including rare species. However, a still unresolved issue are the substantial error rates in the experimental process generating these sequences. To overcome these limitations we propose an approach, where each sample is split and the same amplification and sequencing protocol is applied to both halves. This procedure should allow to detect likely PCR and sequencing artifacts, and true rare species by comparison of the results of both parts. The AmpliconDuo package, whereas ampliconduo from here on refers to the two amplicon data sets of a split sample, is intended to help interpret the obtained amplicon frequency distribution across split samples, and to filter the false positive amplicons. Details
The core of this package is the
Author(s)Anja Lange (anja.lange@uni-due.de) and Daniel Hoffmann (daniel.hoffmann@uni-due.de) Maintainer: Anja Lange (anja.lange@uni-due.de) ReferencesLange A, Jost S, Heider D, Bock C, Budeus B, Schilling E, Strittmatter A, Boenigk J, Hoffmann D: AmpliconDuo: A Split-Sample Filtering Protocol for High-Throughput Amplicon Sequencing of Microbial Communities. (PLoS One. 2015 Nov 2;10(11)) Examples## load test amplicon frequency data ampliconfreqs and vector with sample names site.f data(ampliconfreqs) data(site.f) ## generating ampliconduo data frames ## depending on the size if the data sets, may take some time ampliconduoset <- ampliconduo(ampliconfreqs[,1:4], sample.names = site.f[1:2]) ## plot amplicon read numbers of sample A vs. amplicon read numbers of sample B, ## indicating amplicons with significant deviations in their occurence across samples plotAmpliconduo.set(ampliconduoset, nrow = 3) ## calculate discordance between the two data sets of an ampliconduo discordance <- discordance.delta(ampliconduoset) ## plot the odds ratio density of ampliconduo data plotORdensity(ampliconduoset) ## apply filter criteria to remove/mark spurious amplicons ampliconduoset.f <- filter.ampliconduo.set(ampliconduoset, min.freq = 1, q = 0.05) ## return indices of accepted amplicons, indices correspond to indices of the ampliconfreqs data, ## that were used as input for the ampliconduo function accep.reads <- accepted.amplicons(ampliconduoset.f) Results
R version 3.3.1 (2016-06-21) -- "Bug in Your Hair"
Copyright (C) 2016 The R Foundation for Statistical Computing
Platform: x86_64-pc-linux-gnu (64-bit)
R is free software and comes with ABSOLUTELY NO WARRANTY.
You are welcome to redistribute it under certain conditions.
Type 'license()' or 'licence()' for distribution details.
R is a collaborative project with many contributors.
Type 'contributors()' for more information and
'citation()' on how to cite R or R packages in publications.
Type 'demo()' for some demos, 'help()' for on-line help, or
'help.start()' for an HTML browser interface to help.
Type 'q()' to quit R.
> library(AmpliconDuo)
Loading required package: ggplot2
Loading required package: xtable
> png(filename="/home/ddbj/snapshot/RGM3/R_CC/result/AmpliconDuo/AmpliconDuo-package.Rd_%03d_medium.png", width=480, height=480)
> ### Name: AmpliconDuo-package
> ### Title: Statistical Analysis Of Amplicon Data Of The Same Sample To
> ### Identify Artefacts
> ### Aliases: AmpliconDuo-package AmpliconDuo
> ### Keywords: package
>
> ### ** Examples
>
>
> ## load test amplicon frequency data ampliconfreqs and vector with sample names site.f
> data(ampliconfreqs)
> data(site.f)
>
> ## generating ampliconduo data frames
> ## depending on the size if the data sets, may take some time
> ampliconduoset <- ampliconduo(ampliconfreqs[,1:4], sample.names = site.f[1:2])
..>
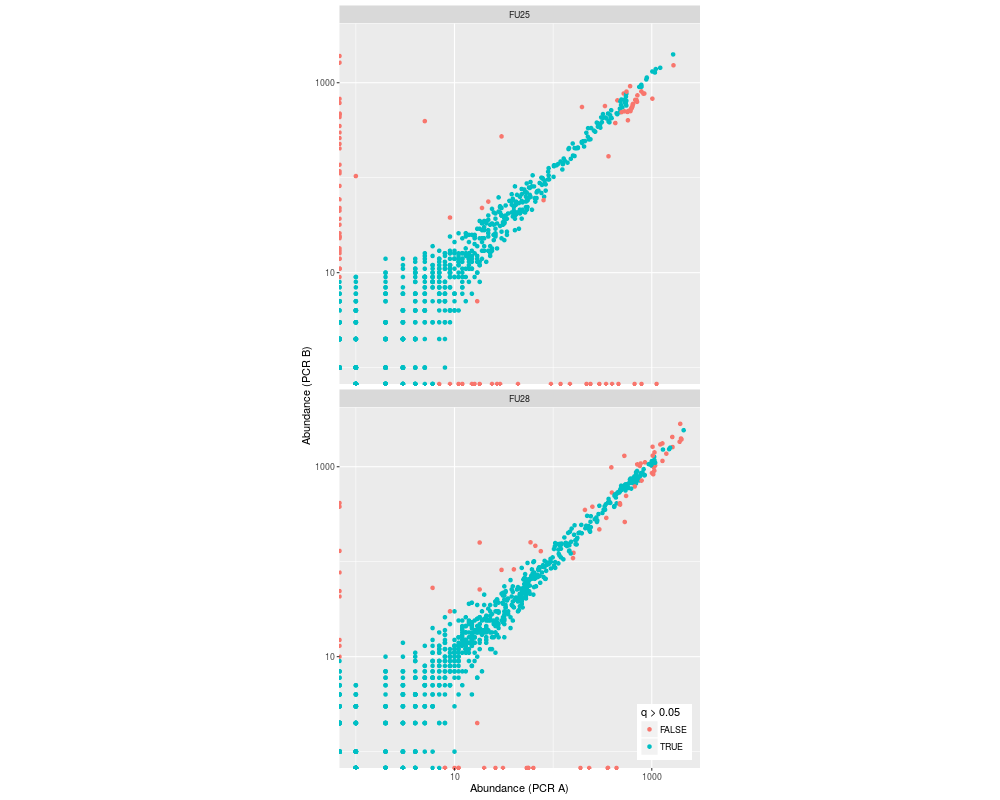
> ## plot amplicon read numbers of sample A vs. amplicon read numbers of sample B,
> ## indicating amplicons with significant deviations in their occurence across samples
> plotAmpliconduo.set(ampliconduoset, nrow = 3)
>
> ## calculate discordance between the two data sets of an ampliconduo
> discordance <- discordance.delta(ampliconduoset)
>
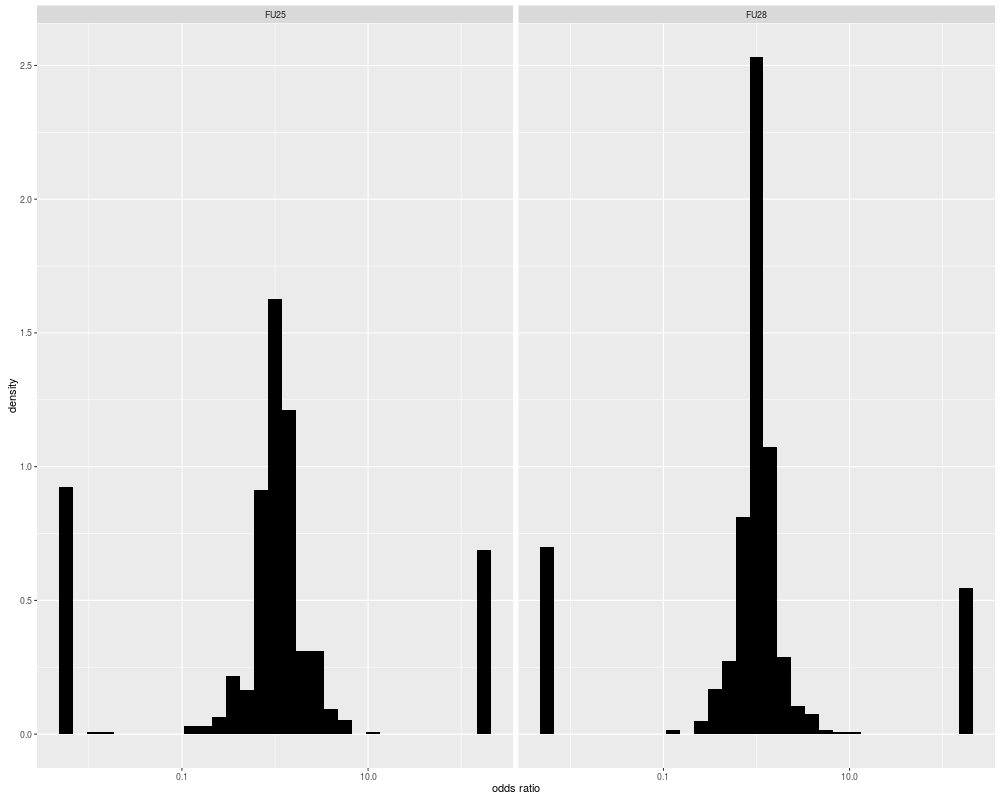
> ## plot the odds ratio density of ampliconduo data
> plotORdensity(ampliconduoset)
>
> ## apply filter criteria to remove/mark spurious amplicons
> ampliconduoset.f <- filter.ampliconduo.set(ampliconduoset, min.freq = 1, q = 0.05)
>
> ## return indices of accepted amplicons, indices correspond to indices of the ampliconfreqs data,
> ## that were used as input for the ampliconduo function
> accep.reads <- accepted.amplicons(ampliconduoset.f)
>
>
>
>
>
> dev.off()
null device
1
>
|