Supported by Dr. Osamu Ogasawara and  . . |
|
Last data update: 2014.03.03 |
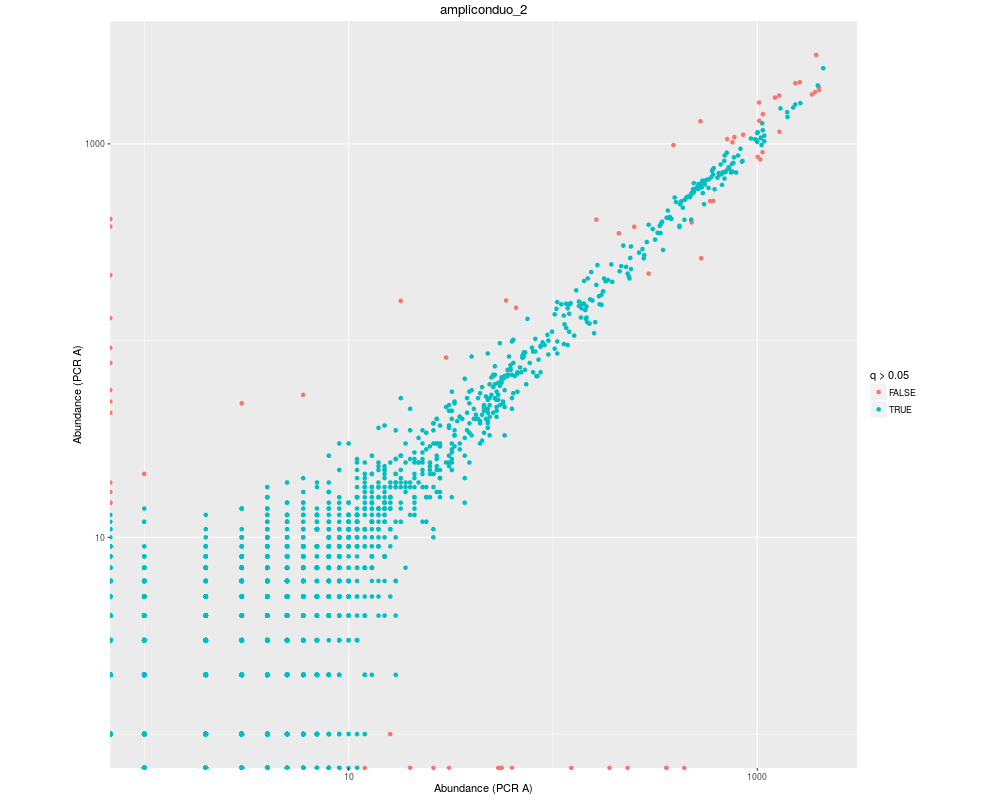
Frequency-Frequency Plot Focusing On Significant Deviations In Amplicon OccurencesDescriptionApplied to an ampliconduo data frame, one element of the return value of
the UsageplotAmpliconduo(x, color.treshold = 0.05, xlab = "Abundance (PCR A)", ylab = "Abundance (PCR B)",main = NULL, log = "xy", corrected = TRUE, asp = 1, legend.position = NULL, save = FALSE, path = NULL, file.name = NULL, format = "jpeg", h.start = 0, ...) Arguments
Author(s)Anja Lange & Daniel Hoffmann Referenceshttp://had.co.nz/ggplot2/book/qplot.pdf See Alsoggplot2 package
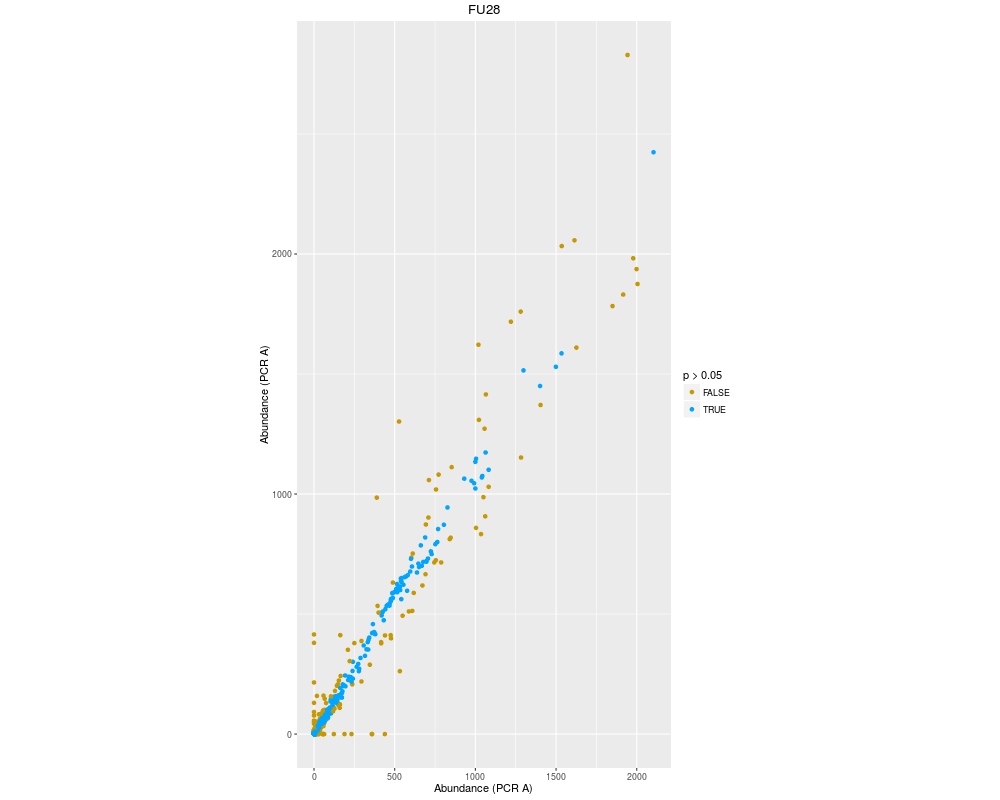
Examples## load example data data(amplicons) ## extract the second ampliconduo data frame ampliconduo2 <- amplicons[[2]] ## plot the amplicon frequencies of the ampliconduo data frame plotAmpliconduo(ampliconduo2, main = "ampliconduo_2") plotAmpliconduo(ampliconduo2, main = "ampliconduo_2", h.start = 50, log = "") plotAmpliconduo(ampliconduo2, h.start = 50, log = "", asp = 2, corrected = FALSE) Results
R version 3.3.1 (2016-06-21) -- "Bug in Your Hair"
Copyright (C) 2016 The R Foundation for Statistical Computing
Platform: x86_64-pc-linux-gnu (64-bit)

R is free software and comes with ABSOLUTELY NO WARRANTY.
You are welcome to redistribute it under certain conditions.
Type 'license()' or 'licence()' for distribution details.

R is a collaborative project with many contributors.
Type 'contributors()' for more information and
'citation()' on how to cite R or R packages in publications.

Type 'demo()' for some demos, 'help()' for on-line help, or
'help.start()' for an HTML browser interface to help.
Type 'q()' to quit R.

> library(AmpliconDuo)
Loading required package: ggplot2
Loading required package: xtable
> png(filename="/home/ddbj/snapshot/RGM3/R_CC/result/AmpliconDuo/plotAmpliconduo.Rd_%03d_medium.png", width=480, height=480)
> ### Name: plotAmpliconduo
> ### Title: Frequency-Frequency Plot Focusing On Significant Deviations In
> ###   Amplicon Occurences
> ### Aliases: plotAmpliconduo
> ### Keywords: hplot
>
> ### ** Examples
>
> ## load example data
> data(amplicons)
>
> ## extract the second ampliconduo data frame
> ampliconduo2 <- amplicons[[2]]
>
> ## plot the amplicon frequencies of the ampliconduo data frame
> plotAmpliconduo(ampliconduo2, main = "ampliconduo_2")
> plotAmpliconduo(ampliconduo2, main = "ampliconduo_2", h.start = 50, log = "")
> plotAmpliconduo(ampliconduo2, h.start = 50, log = "", asp = 2, corrected = FALSE)
>
>
>
>
>
> dev.off()
null device
          1
>
|