Supported by Dr. Osamu Ogasawara and  . . |
|
Last data update: 2014.03.03 |
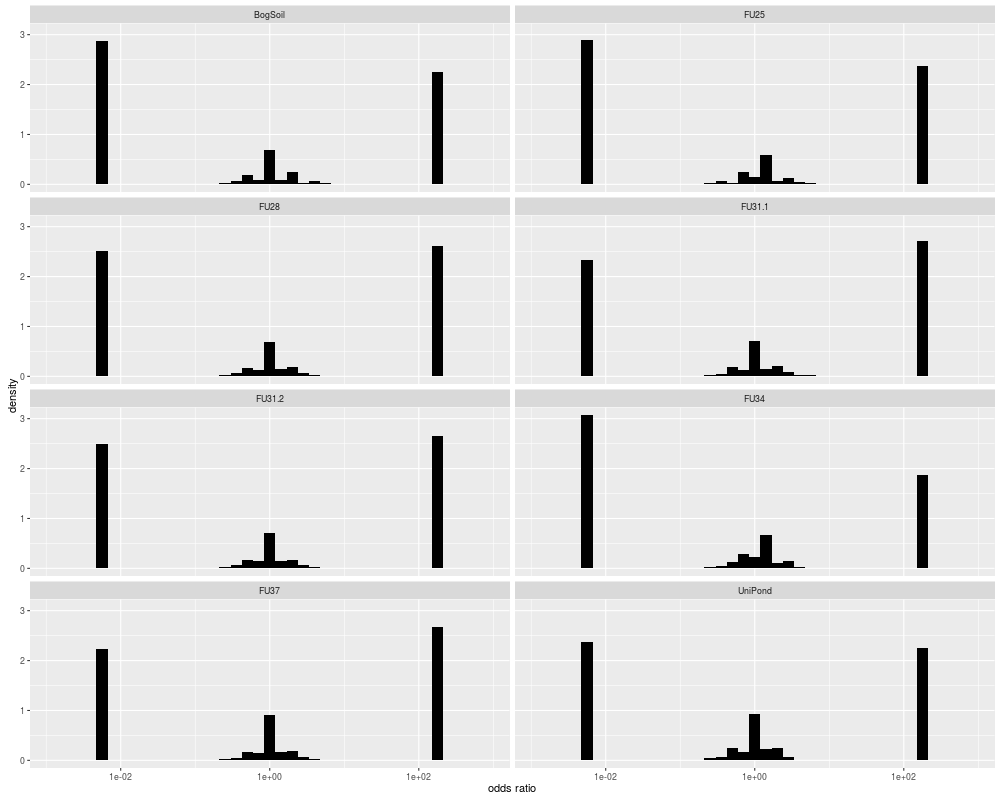
Probability Density Plot Of Odds RatiosDescriptionPlots for an ampliconduo data frame probability densities of the odds ratios of amplicon occurences in the two amplicon data sets. The function allows to shift the two extrema (odds ratios OR = 0 and OR = infinity) to the edges of the plot. Plots of multipe ampliconduo data frames are arranged in a 2-dimensional array with shared scales. UsageplotORdensity(x, log = "x", ncol = 2, adjust.zeroinf = TRUE, zero.pos = 0.005, inf.pos = 200, binwidth = 0.15, color = "black", xlab = "odds ratio", save = FALSE, path = NULL, file.name = NULL, format = "jpeg", ...) Arguments
Author(s)Anja Lange & Daniel Hoffmann See Also
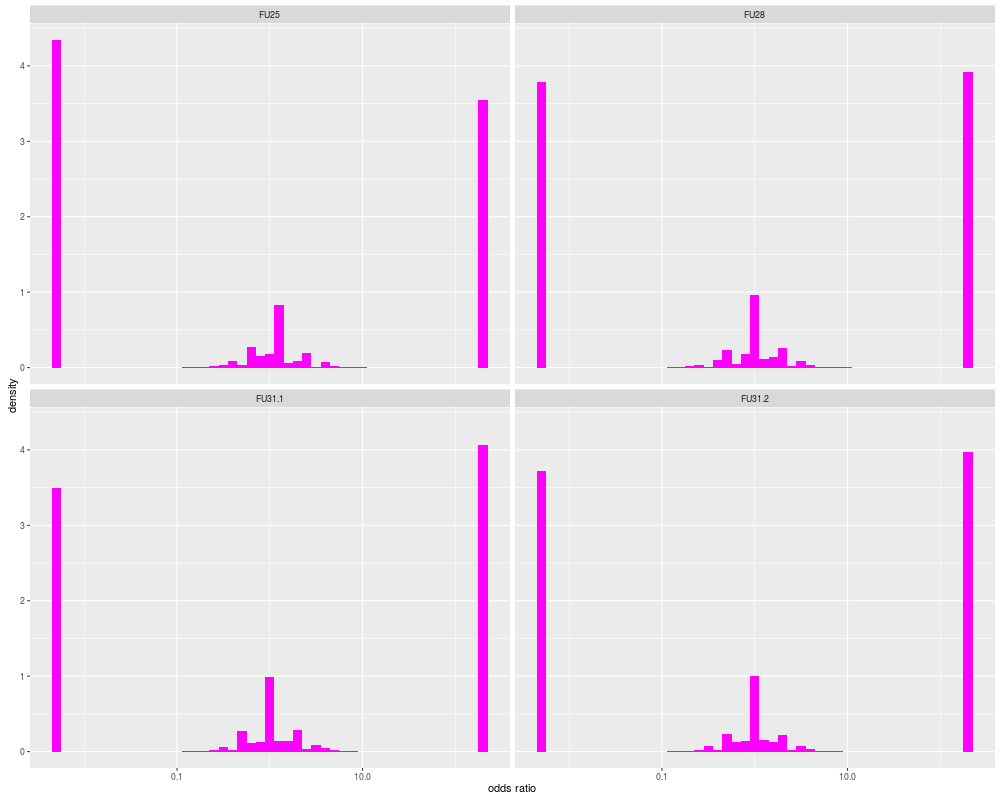
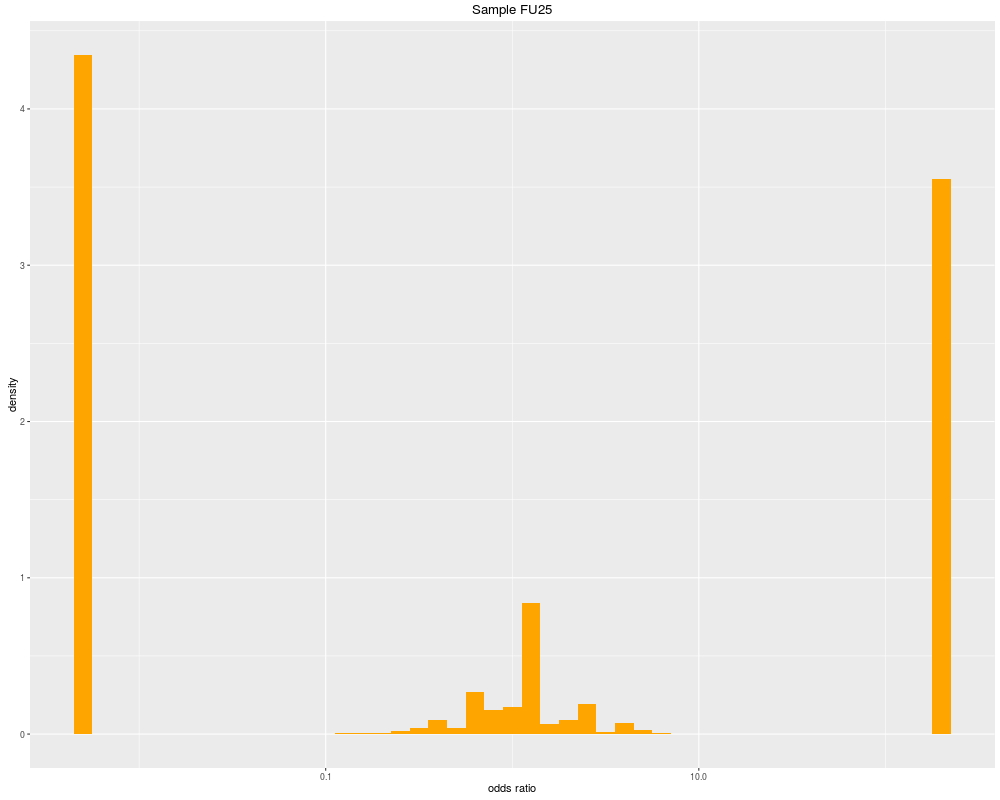
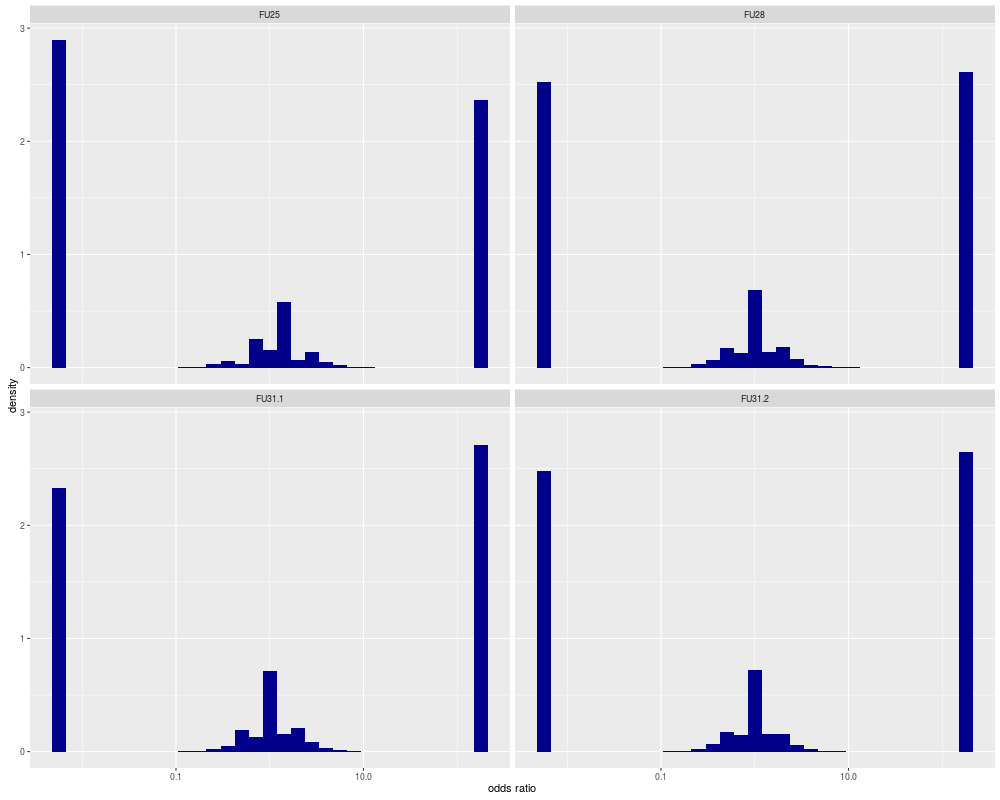
Examples## loads example data of ampliconduo data frames data(amplicons) ## plot odds ratio density for amplicon frequencies in ampliconduo data frames plotORdensity(amplicons) plotORdensity(amplicons[1:4], binwidth = 0.1, color = "magenta") plotORdensity(amplicons[[1]], binwidth = 0.1, color = "orange", main = "Sample FU25") plotORdensity(amplicons[1:4], color = "darkblue", ncol = 2, save = TRUE) Results
R version 3.3.1 (2016-06-21) -- "Bug in Your Hair"
Copyright (C) 2016 The R Foundation for Statistical Computing
Platform: x86_64-pc-linux-gnu (64-bit)

R is free software and comes with ABSOLUTELY NO WARRANTY.
You are welcome to redistribute it under certain conditions.
Type 'license()' or 'licence()' for distribution details.

R is a collaborative project with many contributors.
Type 'contributors()' for more information and
'citation()' on how to cite R or R packages in publications.

Type 'demo()' for some demos, 'help()' for on-line help, or
'help.start()' for an HTML browser interface to help.
Type 'q()' to quit R.

> library(AmpliconDuo)
Loading required package: ggplot2
Loading required package: xtable
> png(filename="/home/ddbj/snapshot/RGM3/R_CC/result/AmpliconDuo/plotORdensity.Rd_%03d_medium.png", width=480, height=480)
> ### Name: plotORdensity
> ### Title: Probability Density Plot Of Odds Ratios
> ### Aliases: plotORdensity
> ### Keywords: hplot
>
> ### ** Examples
>
> ## loads example data of ampliconduo data frames
> data(amplicons)
>
> ## plot odds ratio density for amplicon frequencies in ampliconduo data frames
> plotORdensity(amplicons)
> plotORdensity(amplicons[1:4], binwidth = 0.1, color = "magenta")
> plotORdensity(amplicons[[1]], binwidth = 0.1, color = "orange", main = "Sample FU25")
> plotORdensity(amplicons[1:4],  color = "darkblue", ncol = 2, save = TRUE)
Saving 6.67 x 6.67 in image
>
>
>
>
>
>
> dev.off()
null device
          1
>
|