Supported by Dr. Osamu Ogasawara and  . . |
|
Last data update: 2014.03.03 |
Bin point valuesin Chen-Hsu modelDescriptionCalculating bin point values, which devece divide fuzzy sets in Chen-Hsu model. UsageChenHsu.bin(table, n.subset) Arguments
ValueA vector contain bin point values. Author(s)Hong Viet Minh <hongvietminh@gmail.com> Examplesa<-fuzzy.ts1(lh,type="Chen-Hsu",plot=1) b<-ChenHsu.bin(a$table1,n.subset=c(1,2,1,1,1)) fuzzy.ts1(lh,type="Chen-Hsu",bin=b,plot=1,trace=1) Results
R version 3.3.1 (2016-06-21) -- "Bug in Your Hair"
Copyright (C) 2016 The R Foundation for Statistical Computing
Platform: x86_64-pc-linux-gnu (64-bit)
R is free software and comes with ABSOLUTELY NO WARRANTY.
You are welcome to redistribute it under certain conditions.
Type 'license()' or 'licence()' for distribution details.
R is a collaborative project with many contributors.
Type 'contributors()' for more information and
'citation()' on how to cite R or R packages in publications.
Type 'demo()' for some demos, 'help()' for on-line help, or
'help.start()' for an HTML browser interface to help.
Type 'q()' to quit R.
> library(AnalyzeTS)
Loading required package: MASS
Loading required package: TSA
Loading required package: leaps
Loading required package: locfit
locfit 1.5-9.1 2013-03-22
Loading required package: mgcv
Loading required package: nlme
This is mgcv 1.8-12. For overview type 'help("mgcv-package")'.
Loading required package: tseries
Attaching package: 'TSA'
The following objects are masked from 'package:stats':
acf, arima
The following object is masked from 'package:utils':
tar
Loading required package: TTR
> png(filename="/home/ddbj/snapshot/RGM3/R_CC/result/AnalyzeTS/ChenHsu.bin.Rd_%03d_medium.png", width=480, height=480)
> ### Name: ChenHsu.bin
> ### Title: Bin point valuesin Chen-Hsu model
> ### Aliases: ChenHsu.bin
> ### Keywords: ChenHsu.bin
>
> ### ** Examples
>
> a<-fuzzy.ts1(lh,type="Chen-Hsu",plot=1)
> b<-ChenHsu.bin(a$table1,n.subset=c(1,2,1,1,1))
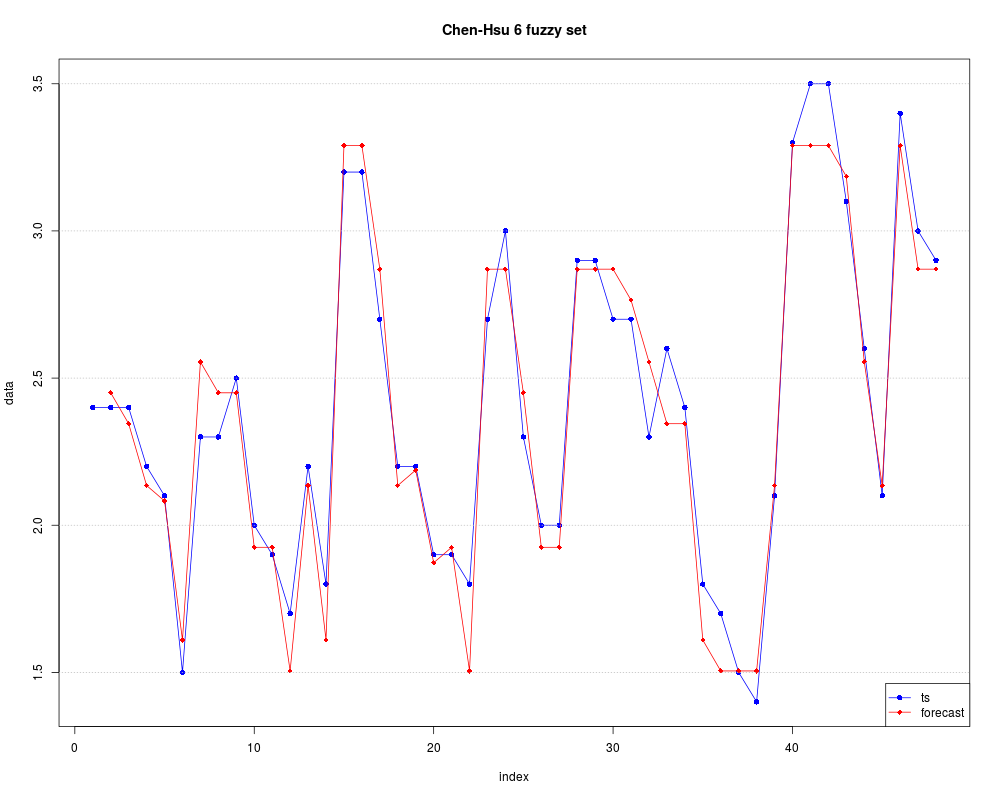
> fuzzy.ts1(lh,type="Chen-Hsu",bin=b,plot=1,trace=1)
$type
[1] "Chen-Hsu"
$table1
set dow up mid num
1 A1 1.40 1.82 1.610 8
2 A2 1.82 2.03 1.925 6
3 A3 2.03 2.24 2.135 7
4 A4 2.24 2.66 2.450 11
5 A5 2.66 3.08 2.870 9
6 A6 3.08 3.50 3.290 7
$table2
point ts relative forecast
1 1 2.4 A4-x-NA NA
2 2 2.4 A4<--A4 2.4500
3 3 2.4 A4<--A4 2.3450
4 4 2.2 A3<--A4 2.1350
5 5 2.1 A3<--A3 2.0825
6 6 1.5 A1<--A3 1.6100
7 7 2.3 A4<--A1 2.5550
8 8 2.3 A4<--A4 2.4500
9 9 2.5 A4<--A4 2.4500
10 10 2.0 A2<--A4 1.9250
11 11 1.9 A2<--A2 1.9250
12 12 1.7 A1<--A2 1.5050
13 13 2.2 A3<--A1 2.1350
14 14 1.8 A1<--A3 1.6100
15 15 3.2 A6<--A1 3.2900
16 16 3.2 A6<--A6 3.2900
17 17 2.7 A5<--A6 2.8700
18 18 2.2 A3<--A5 2.1350
19 19 2.2 A3<--A3 2.1875
20 20 1.9 A2<--A3 1.8725
21 21 1.9 A2<--A2 1.9250
22 22 1.8 A1<--A2 1.5050
23 23 2.7 A5<--A1 2.8700
24 24 3.0 A5<--A5 2.8700
25 25 2.3 A4<--A5 2.4500
26 26 2.0 A2<--A4 1.9250
27 27 2.0 A2<--A2 1.9250
28 28 2.9 A5<--A2 2.8700
29 29 2.9 A5<--A5 2.8700
30 30 2.7 A5<--A5 2.8700
31 31 2.7 A5<--A5 2.7650
32 32 2.3 A4<--A5 2.5550
33 33 2.6 A4<--A4 2.3450
34 34 2.4 A4<--A4 2.3450
35 35 1.8 A1<--A4 1.6100
36 36 1.7 A1<--A1 1.5050
37 37 1.5 A1<--A1 1.5050
38 38 1.4 A1<--A1 1.5050
39 39 2.1 A3<--A1 2.1350
40 40 3.3 A6<--A3 3.2900
41 41 3.5 A6<--A6 3.2900
42 42 3.5 A6<--A6 3.2900
43 43 3.1 A6<--A6 3.1850
44 44 2.6 A4<--A6 2.5550
45 45 2.1 A3<--A4 2.1350
46 46 3.4 A6<--A3 3.2900
47 47 3.0 A5<--A6 2.8700
48 48 2.9 A5<--A5 2.8700
$accuracy
ME MAE MPE MAPE MSE RMSE U
Chen.Hsu 0.018 0.105 0.867 4.616 0.017 0.13 0.259
>
>
>
>
>
> dev.off()
null device
1
>
|
Created & Maintained by Osamu Ogasawara (osamu.ogasawara@gmail.com) and 