Supported by Dr. Osamu Ogasawara and  . . |
|
Last data update: 2014.03.03 |
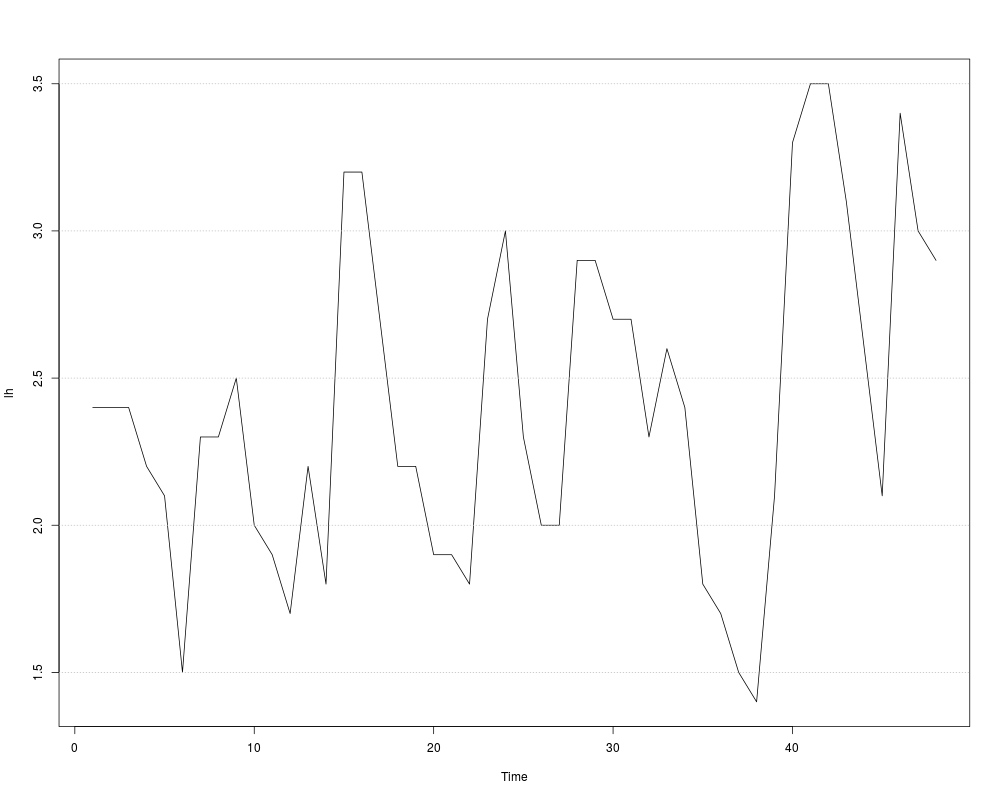
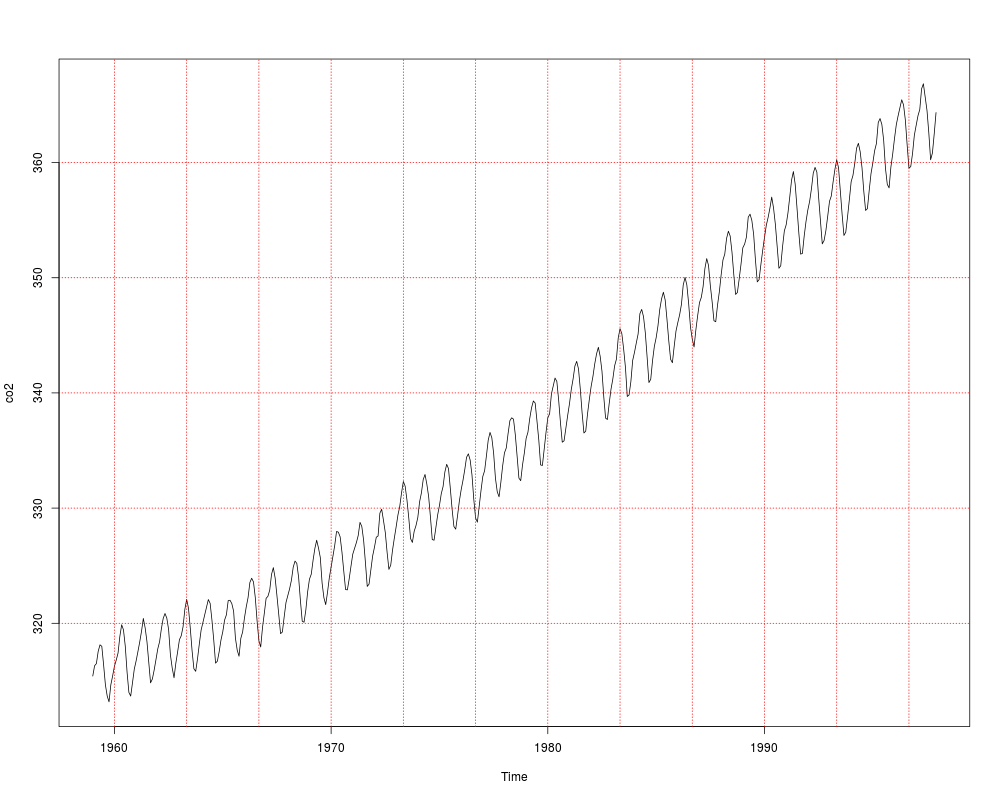
Grid onDescriptionPaint to line graph. Usagegrid.on(h = TRUE, v = TRUE, col = "gray", nv = 1, nh = 1, lty = 3) Arguments
ValueA grid is painted in graph. Author(s)Hong Vet Minh <hongvietminh@gmail.com> Examplesplot(lh) grid.on(h=TRUE,v=FALSE) plot(co2) grid.on(col="red",nv=3) Results
R version 3.3.1 (2016-06-21) -- "Bug in Your Hair"
Copyright (C) 2016 The R Foundation for Statistical Computing
Platform: x86_64-pc-linux-gnu (64-bit)

R is free software and comes with ABSOLUTELY NO WARRANTY.
You are welcome to redistribute it under certain conditions.
Type 'license()' or 'licence()' for distribution details.

R is a collaborative project with many contributors.
Type 'contributors()' for more information and
'citation()' on how to cite R or R packages in publications.

Type 'demo()' for some demos, 'help()' for on-line help, or
'help.start()' for an HTML browser interface to help.
Type 'q()' to quit R.

> library(AnalyzeTS)
Loading required package: MASS
Loading required package: TSA
Loading required package: leaps
Loading required package: locfit
locfit 1.5-9.1 	 2013-03-22
Loading required package: mgcv
Loading required package: nlme
This is mgcv 1.8-12. For overview type 'help("mgcv-package")'.
Loading required package: tseries

Attaching package: 'TSA'

The following objects are masked from 'package:stats':

    acf, arima

The following object is masked from 'package:utils':

    tar

Loading required package: TTR
> png(filename="/home/ddbj/snapshot/RGM3/R_CC/result/AnalyzeTS/grid.on.Rd_%03d_medium.png", width=480, height=480)
> ### Name: grid.on
> ### Title: Grid on
> ### Aliases: grid.on
> ### Keywords: grid.on
>
> ### ** Examples
>
> plot(lh)
> grid.on(h=TRUE,v=FALSE)
> plot(co2)
> grid.on(col="red",nv=3)
>
>
>
>
>
> dev.off()
null device
          1
>
|
Created & Maintained by Osamu Ogasawara (osamu.ogasawara@gmail.com) and 