Supported by Dr. Osamu Ogasawara and  . . |
|
Last data update: 2014.03.03 |
Trimmed or outlier observations representationDescriptionThis function represents the scatter plots of bust circumference against other selected variable (chest,hip,neck to ground or waist) jointly with the trimmed individuals discarded in each bust class provided by UsageplotTrimmOutl(data,trimmOutl,nsizes,bustVariable,variable,col,xlim,ylim,main) Arguments
ValueA device with the desired plot. Author(s)Guillermo Vinue ReferencesIbanez, M. V., Vinue, G., Alemany, S., Simo, A., Epifanio, I., Domingo, J., and Ayala, G., (2012). Apparel sizing using trimmed PAM and OWA operators, Expert Systems with Applications 39, 10512–10520. Vinue, G., Leon, T., Alemany, S., and Ayala, G., (2013). Looking for representative fit models for apparel sizing, Decision Support Systems 57, 22–33. See Also
Examples
#TRIMOWA ALGORITHM:
dataTrimowa <- sampleSpanishSurvey
numVar <- dim(dataTrimowa)[2]
bust <- dataTrimowa$bust
bustSizes <- bustSizesStandard(seq(74, 102, 4), seq(107, 131, 6))
orness <- 0.7
weightsTrimowa <- weightsMixtureUB(orness, numVar)
numClust <- 3 ; alpha <- 0.01 ; niter <- 10 ; algSteps <- 7
ah <- c(23, 28, 20, 25, 25)
set.seed(2014)
numSizes <- 1
res_trimowa <- computSizesTrimowa(dataTrimowa, bust, bustSizes$bustCirc, numSizes,
weightsTrimowa, numClust, alpha, niter, algSteps,
ah, FALSE)
prototypes <- anthrCases(res_trimowa, numSizes)
trimmed <- trimmOutl(res_trimowa, numSizes)
bustVariable <- "bust"
xlim <- c(72, 132)
color <- c("black", "red", "green", "blue", "cyan", "brown", "gray",
"deeppink3", "orange", "springgreen4", "khaki3", "steelblue1")
variable <- "chest"
range(dataTrimowa[,variable])
#[1] 76.7755 135.8580
ylim <- c(70,140)
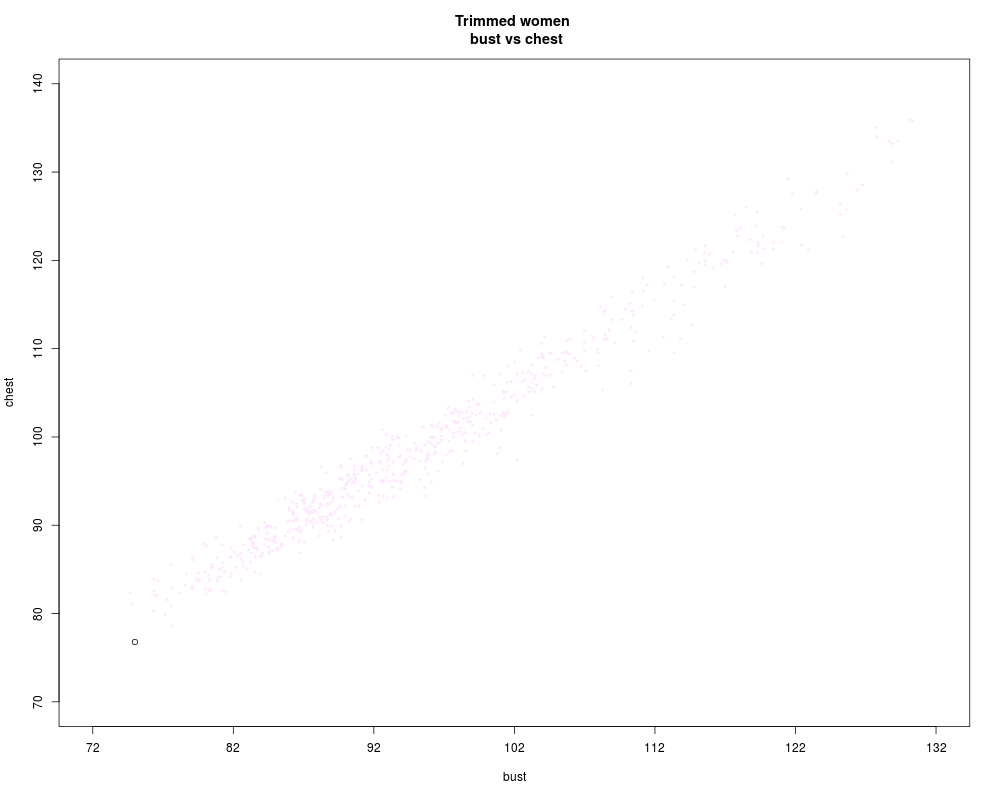
main <- "Trimmed women \n bust vs chest"
plotTrimmOutl(dataTrimowa, trimmed, numSizes, bustVariable, variable, color,
xlim, ylim, main)
#For other plots and an example for the hipam algorithm,
#see www.uv.es/vivigui/softw/more_examples.R
Results
R version 3.3.1 (2016-06-21) -- "Bug in Your Hair"
Copyright (C) 2016 The R Foundation for Statistical Computing
Platform: x86_64-pc-linux-gnu (64-bit)

R is free software and comes with ABSOLUTELY NO WARRANTY.
You are welcome to redistribute it under certain conditions.
Type 'license()' or 'licence()' for distribution details.

R is a collaborative project with many contributors.
Type 'contributors()' for more information and
'citation()' on how to cite R or R packages in publications.

Type 'demo()' for some demos, 'help()' for on-line help, or
'help.start()' for an HTML browser interface to help.
Type 'q()' to quit R.

> library(Anthropometry)
> png(filename="/home/ddbj/snapshot/RGM3/R_CC/result/Anthropometry/plotTrimmOutl.Rd_%03d_medium.png", width=480, height=480)
> ### Name: plotTrimmOutl
> ### Title: Trimmed or outlier observations representation
> ### Aliases: plotTrimmOutl
> ### Keywords: dplot
>
> ### ** Examples
>
> #TRIMOWA ALGORITHM:
> dataTrimowa <- sampleSpanishSurvey
> numVar <- dim(dataTrimowa)[2]
> bust <- dataTrimowa$bust
> bustSizes <- bustSizesStandard(seq(74, 102, 4), seq(107, 131, 6))
>
> orness <- 0.7
> weightsTrimowa <- weightsMixtureUB(orness, numVar)
>
> numClust <- 3 ; alpha <- 0.01 ; niter <- 10 ; algSteps <- 7
> ah <- c(23, 28, 20, 25, 25)
>
> set.seed(2014)
> numSizes <- 1
> res_trimowa <- computSizesTrimowa(dataTrimowa, bust, bustSizes$bustCirc, numSizes,
+                                   weightsTrimowa, numClust, alpha, niter, algSteps,
+                                   ah, FALSE)
>
> prototypes <- anthrCases(res_trimowa, numSizes)
> trimmed <- trimmOutl(res_trimowa, numSizes)
>
> bustVariable <- "bust"
> xlim <- c(72, 132)
> color <- c("black", "red", "green", "blue", "cyan", "brown", "gray",
+            "deeppink3", "orange", "springgreen4", "khaki3", "steelblue1")
>
> variable <- "chest"
> range(dataTrimowa[,variable])
[1]  76.7755 135.8580
> #[1] 76.7755 135.8580
> ylim <- c(70,140)
> main <- "Trimmed women \n bust vs chest"
>
> plotTrimmOutl(dataTrimowa, trimmed, numSizes, bustVariable, variable, color,
+               xlim, ylim, main)
>
> #For other plots and an example for the hipam algorithm,
> #see www.uv.es/vivigui/softw/more_examples.R
>
>
>
>
>
> dev.off()
null device
          1
>
|