Supported by Dr. Osamu Ogasawara and  . . |
|
Last data update: 2014.03.03 |
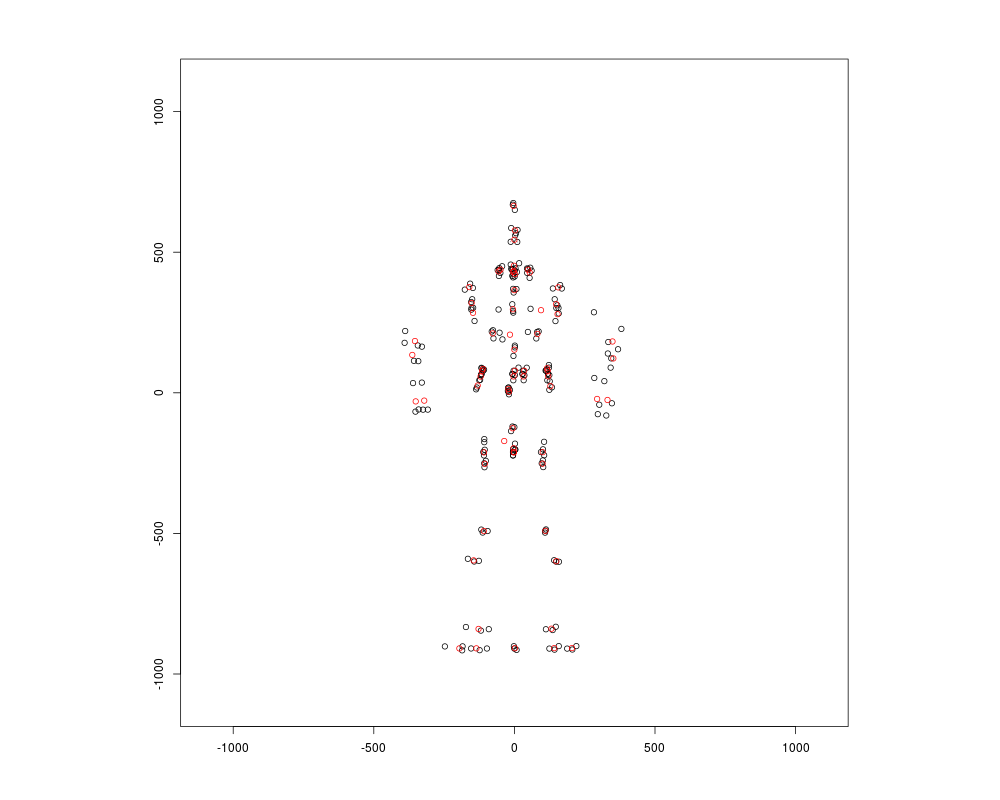
Helper function for plotting the shapesDescriptionHelper function for plotting the projections of the shapes. It displays the projection on the xy plane of the recorded points and mean shape for a given cluster. To that end, first it is needed to carry out a generalized Procrustes analysis in the cluster to obtain the full Procrustes rotated data. UsageprojShapes(clust,array3D,asig,prototypes) Arguments
ValueNumerical vector with the percentile values of an archetypoid. Author(s)Guillermo Vinue ReferencesVinue, G., Simo, A., and Alemany, S., (2014). The k-means algorithm for 3D shapes with an application to apparel design, Advances in Data Analysis and Classification, 1–30. See Also
Examples
landmarksNoNa <- na.exclude(landmarksSampleSpaSurv)
dim(landmarksNoNa)
#[1] 574 198
numLandmarks <- (dim(landmarksNoNa)[2]) / 3
#[1] 66
#As a toy example, only the first 15 individuals are used.
landmarksNoNa_First10 <- landmarksNoNa[1:10, ]
(numIndiv <- dim(landmarksNoNa_First10)[1])
#[1] 10

array3D <- array3Dlandm(numLandmarks, numIndiv, landmarksNoNa_First10)
#shapes::plotshapes(array3D[,,1])
#calibrate::textxy(array3D[,1,1], array3D[,2,1], labs = 1:numLandmarks, cex = 0.7)

numClust <- 2 ; algSteps <- 1 ; niter <- 1 ; stopCr <- 0.0001
resLL <- LloydShapes(array3D, numClust, algSteps, niter, stopCr, FALSE, FALSE)
clust_kmeansProc <- resLL$asig

prototypes <- anthrCases(resLL)

projShapes(1, array3D, clust_kmeansProc, prototypes)
#legend("topleft", c("Registrated data", "Mean shape"), pch = 1, col = 1:2, text.col = 1:2)
#title("Procrustes registrated data for cluster 1 \n with its mean shape superimposed",
#      sub = "Plane xy")
Results
R version 3.3.1 (2016-06-21) -- "Bug in Your Hair"
Copyright (C) 2016 The R Foundation for Statistical Computing
Platform: x86_64-pc-linux-gnu (64-bit)

R is free software and comes with ABSOLUTELY NO WARRANTY.
You are welcome to redistribute it under certain conditions.
Type 'license()' or 'licence()' for distribution details.

R is a collaborative project with many contributors.
Type 'contributors()' for more information and
'citation()' on how to cite R or R packages in publications.

Type 'demo()' for some demos, 'help()' for on-line help, or
'help.start()' for an HTML browser interface to help.
Type 'q()' to quit R.

> library(Anthropometry)
> png(filename="/home/ddbj/snapshot/RGM3/R_CC/result/Anthropometry/projShapes.Rd_%03d_medium.png", width=480, height=480)
> ### Name: projShapes
> ### Title: Helper function for plotting the shapes
> ### Aliases: projShapes
> ### Keywords: math
>
> ### ** Examples
>
> landmarksNoNa <- na.exclude(landmarksSampleSpaSurv)
> dim(landmarksNoNa)
[1] 574 198
> #[1] 574 198
> numLandmarks <- (dim(landmarksNoNa)[2]) / 3
> #[1] 66
> #As a toy example, only the first 15 individuals are used.
> landmarksNoNa_First10 <- landmarksNoNa[1:10, ]
> (numIndiv <- dim(landmarksNoNa_First10)[1])
[1] 10
> #[1] 10
>
> array3D <- array3Dlandm(numLandmarks, numIndiv, landmarksNoNa_First10)
> #shapes::plotshapes(array3D[,,1])
> #calibrate::textxy(array3D[,1,1], array3D[,2,1], labs = 1:numLandmarks, cex = 0.7)
>
> numClust <- 2 ; algSteps <- 1 ; niter <- 1 ; stopCr <- 0.0001
> resLL <- LloydShapes(array3D, numClust, algSteps, niter, stopCr, FALSE, FALSE)
> clust_kmeansProc <- resLL$asig
>
> prototypes <- anthrCases(resLL)
>
> projShapes(1, array3D, clust_kmeansProc, prototypes)
> #legend("topleft", c("Registrated data", "Mean shape"), pch = 1, col = 1:2, text.col = 1:2)
> #title("Procrustes registrated data for cluster 1 \n with its mean shape superimposed",
> #      sub = "Plane xy")
>
>
>
>
>
> dev.off()
null device
          1
>
|