Supported by Dr. Osamu Ogasawara and  . . |
|
Last data update: 2014.03.03 |
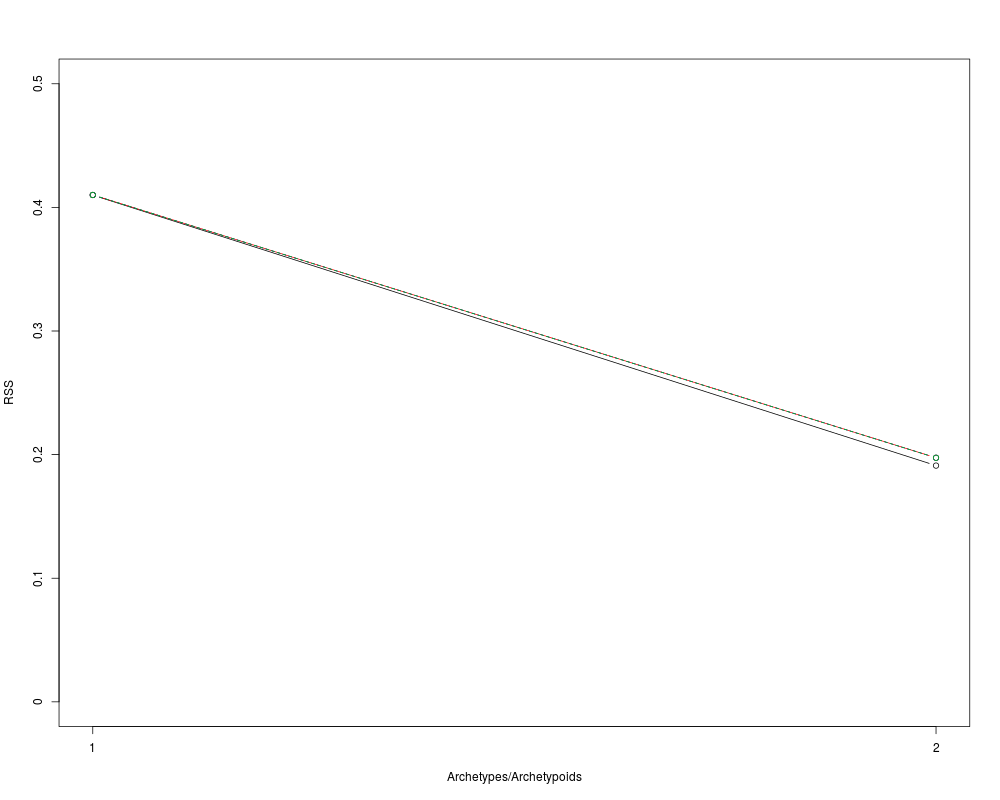
Screeplot of archetypal individualsDescriptionThis function allows us to represent in the same plot the screeplot of the archetypes and the both cand_ns, cand_alpha and cand_beta archetypoids. Usage
screeArchetypal(numArch,rss_lass_def,rss_step_ns,rss_step_alpha,rss_step_beta,
                ylim,main,xlab,ylab,col=c("red","blue","green3"),axis2,seq,leg)
Arguments
ValueA device with the desired plot. Author(s)Guillermo Vinue ReferencesVinue, G., Epifanio, I., and Alemany, S., (2015). Archetypoids: a new approach to define representative archetypal data, Computational Statistics and Data Analysis 87, 102–115. Cutler, A., and Breiman, L., (1994). Archetypal Analysis, Technometrics 36, 338–347. Epifanio, I., Vinue, G., and Alemany, S., (2013). Archetypal analysis: contributions for estimating boundary cases in multivariate accommodation problem, Computers & Industrial Engineering 64, 757–765. Eugster, M. J., and Leisch, F., (2009). From Spider-Man to Hero - Archetypal Analysis in R, Journal of Statistical Software 30, 1–23, http://www.jstatsoft.org/. Eugster, M. J. A., (2012). Performance profiles based on archetypal athletes, International Journal of Performance Analysis in Sport 12, 166–187. See Also
Examples
#COCKPIT DESIGN PROBLEM:
#The following R code allows us to obtain a similar plot regarding Figure 5
#of the paper Vinue et al. (2015).
USAFSurvey_First25 <- USAFSurvey[1:25, ]
#Variable selection:
variabl_sel <- c(48, 40, 39, 33, 34, 36)
#Changing to inches:
USAFSurvey_First25_inch <- USAFSurvey_First25[,variabl_sel] / (10 * 2.54)

#Data preprocessing:
USAFSurvey_preproc <- preprocessing(USAFSurvey_First25_inch, TRUE, 0.95, TRUE)

#For reproducing results, seed for randomness:
set.seed(2010)
#Run archetype algorithm repeatedly from 1 to numArch archetypes:
#This is a toy example. In other situation, choose numArch=10 and numRep=20.
numArch <- 2 ; numRep <- 2
lass <- stepArchetypesRawData(data = USAFSurvey_preproc$data,
                          numArch=1:numArch, numRep = numRep,
                          verbose = FALSE)
#To understand the warning messages, see the vignette of the
#archetypes package.

rss_lass <- matrix(0, nrow = numArch, ncol = numRep)
for(i in 1:numArch){
  for(j in 1:numRep){
    rss_lass[i,j] <- lass[[i]][[j]]$rss
  }
}
(rss_lass_def <- apply(rss_lass, 1, min, na.rm = TRUE))

#Run archetypoids algorithm repeatedly from 1 to numArch archetypes:
for(numArchoid in 1:numArch){
  temp <-  stepArchetypoids(numArchoid, nearest = "cand_ns",
                            USAFSurvey_preproc$data, lass)
  filename <- paste("res_ns", numArchoid, sep = "")
  assign(filename,temp)
  save(list = c(filename), file = paste(filename, ".RData", sep = ""))
}

#Run archetypoids algorithm repeatedly from 1 to numArch archetypes:
for(numArchoid in 1:numArch){
  temp <-  stepArchetypoids(numArchoid, nearest = "cand_alpha",
                            USAFSurvey_preproc$data, lass)
  filename <- paste("res_alpha", numArchoid, sep = "")
  assign(filename,temp)
  save(list = c(filename), file = paste(filename, ".RData", sep = ""))
}

#Run archetypoids algorithm repeatedly from 1 to numArch archetypes:
for(numArchoid in 1:numArch){
  temp <-  stepArchetypoids(numArchoid, nearest = "cand_beta",
                            USAFSurvey_preproc$data, lass)
  filename <- paste("res_beta", numArchoid, sep = "")
  assign(filename,temp)
  save(list = c(filename), file = paste(filename, ".RData", sep = ""))
}

#Numerical and graphical results:
#Cand_ns:
for(i in 1:numArch){
  load(paste("res_ns", i, ".RData", sep = ""))
}
rss_step <- c()
for (i in 1:numArch){
  rss_step[i] <- get(paste("res_ns", i, sep = ""))[[2]]
}
(rss_step_ns <- as.numeric(rss_step))

#Cand_alpha:
for(i in 1:numArch){
  load(paste("res_alpha", i, ".RData", sep = ""))
}
rss_step_which <- c()
for (i in 1:numArch){
  rss_step_which[i] <- get(paste("res_alpha", i, sep = ""))[[2]]
}
(rss_step_alpha <- as.numeric(rss_step_which))

#Cand_beta:
for(i in 1:numArch){
  load(paste("res_beta", i, ".RData", sep = ""))
}
rss_step_which <- c()
for (i in 1:numArch){
  rss_step_which[i] <- get(paste("res_beta", i, sep = ""))[[2]]
}
(rss_step_beta <- as.numeric(rss_step_which))

forYlim <- c(rss_lass_def, rss_step_ns, rss_step_alpha, rss_step_beta)
range(forYlim)
#[1] 0.06387125 0.27395811

#main <- "Aircraft pilots archetypes and archetypoids"
xlab <- "Archetypes/Archetypoids"
ylab <- "RSS"
screeArchetypal(numArch, rss_lass_def, rss_step_ns, rss_step_alpha, rss_step_beta,
                c(0,0.5), main = "", xlab, ylab, col = c("red","blue","green3"),
                TRUE, seq(0,0.5,0.1), FALSE)
Results
R version 3.3.1 (2016-06-21) -- "Bug in Your Hair"
Copyright (C) 2016 The R Foundation for Statistical Computing
Platform: x86_64-pc-linux-gnu (64-bit)

R is free software and comes with ABSOLUTELY NO WARRANTY.
You are welcome to redistribute it under certain conditions.
Type 'license()' or 'licence()' for distribution details.

R is a collaborative project with many contributors.
Type 'contributors()' for more information and
'citation()' on how to cite R or R packages in publications.

Type 'demo()' for some demos, 'help()' for on-line help, or
'help.start()' for an HTML browser interface to help.
Type 'q()' to quit R.

> library(Anthropometry)
> png(filename="/home/ddbj/snapshot/RGM3/R_CC/result/Anthropometry/screeArchetypal.Rd_%03d_medium.png", width=480, height=480)
> ### Name: screeArchetypal
> ### Title: Screeplot of archetypal individuals
> ### Aliases: screeArchetypal
> ### Keywords: math
>
> ### ** Examples
>
> #COCKPIT DESIGN PROBLEM:
> #The following R code allows us to obtain a similar plot regarding Figure 5
> #of the paper Vinue et al. (2015).
> USAFSurvey_First25 <- USAFSurvey[1:25, ]
> #Variable selection:
> variabl_sel <- c(48, 40, 39, 33, 34, 36)
> #Changing to inches:
> USAFSurvey_First25_inch <- USAFSurvey_First25[,variabl_sel] / (10 * 2.54)
>
> #Data preprocessing:
> USAFSurvey_preproc <- preprocessing(USAFSurvey_First25_inch, TRUE, 0.95, TRUE)
[1] "The percentage of accommodation is exactly 100%"
>
> #For reproducing results, seed for randomness:
> set.seed(2010)
> #Run archetype algorithm repeatedly from 1 to numArch archetypes:
> #This is a toy example. In other situation, choose numArch=10 and numRep=20.
> numArch <- 2 ; numRep <- 2
> lass <- stepArchetypesRawData(data = USAFSurvey_preproc$data,
+                           numArch=1:numArch, numRep = numRep,
+                           verbose = FALSE)
> #To understand the warning messages, see the vignette of the
> #archetypes package.
>
> rss_lass <- matrix(0, nrow = numArch, ncol = numRep)
> for(i in 1:numArch){
+   for(j in 1:numRep){
+     rss_lass[i,j] <- lass[[i]][[j]]$rss
+   }
+ }
> (rss_lass_def <- apply(rss_lass, 1, min, na.rm = TRUE))
[1] 0.4099541 0.1911030
>
> #Run archetypoids algorithm repeatedly from 1 to numArch archetypes:
> for(numArchoid in 1:numArch){
+   temp <-  stepArchetypoids(numArchoid, nearest = "cand_ns",
+                             USAFSurvey_preproc$data, lass)
+   filename <- paste("res_ns", numArchoid, sep = "")
+   assign(filename,temp)
+   save(list = c(filename), file = paste(filename, ".RData", sep = ""))
+ }
Done!Done!>
> #Run archetypoids algorithm repeatedly from 1 to numArch archetypes:
> for(numArchoid in 1:numArch){
+   temp <-  stepArchetypoids(numArchoid, nearest = "cand_alpha",
+                             USAFSurvey_preproc$data, lass)
+   filename <- paste("res_alpha", numArchoid, sep = "")
+   assign(filename,temp)
+   save(list = c(filename), file = paste(filename, ".RData", sep = ""))
+ }
Done!Done!>
> #Run archetypoids algorithm repeatedly from 1 to numArch archetypes:
> for(numArchoid in 1:numArch){
+   temp <-  stepArchetypoids(numArchoid, nearest = "cand_beta",
+                             USAFSurvey_preproc$data, lass)
+   filename <- paste("res_beta", numArchoid, sep = "")
+   assign(filename,temp)
+   save(list = c(filename), file = paste(filename, ".RData", sep = ""))
+ }
Done!Done!>
> #Numerical and graphical results:
> #Cand_ns:
> for(i in 1:numArch){
+   load(paste("res_ns", i, ".RData", sep = ""))
+ }
> rss_step <- c()
> for (i in 1:numArch){
+   rss_step[i] <- get(paste("res_ns", i, sep = ""))[[2]]
+ }
> (rss_step_ns <- as.numeric(rss_step))
[1] 0.4100631 0.1974400
>
> #Cand_alpha:
> for(i in 1:numArch){
+   load(paste("res_alpha", i, ".RData", sep = ""))
+ }
> rss_step_which <- c()
> for (i in 1:numArch){
+   rss_step_which[i] <- get(paste("res_alpha", i, sep = ""))[[2]]
+ }
> (rss_step_alpha <- as.numeric(rss_step_which))
[1] 0.4100631 0.1974400
>
> #Cand_beta:
> for(i in 1:numArch){
+   load(paste("res_beta", i, ".RData", sep = ""))
+ }
> rss_step_which <- c()
> for (i in 1:numArch){
+   rss_step_which[i] <- get(paste("res_beta", i, sep = ""))[[2]]
+ }
> (rss_step_beta <- as.numeric(rss_step_which))
[1] 0.4100631 0.1974400
>
> forYlim <- c(rss_lass_def, rss_step_ns, rss_step_alpha, rss_step_beta)
> range(forYlim)
[1] 0.1911030 0.4100631
> #[1] 0.06387125 0.27395811
>
> #main <- "Aircraft pilots archetypes and archetypoids"
> xlab <- "Archetypes/Archetypoids"
> ylab <- "RSS"
> screeArchetypal(numArch, rss_lass_def, rss_step_ns, rss_step_alpha, rss_step_beta,
+                 c(0,0.5), main = "", xlab, ylab, col = c("red","blue","green3"),
+                 TRUE, seq(0,0.5,0.1), FALSE)
>
>
>
>
>
> dev.off()
null device
          1
>
|