Supported by Dr. Osamu Ogasawara and  . . |
|
Last data update: 2014.03.03 |
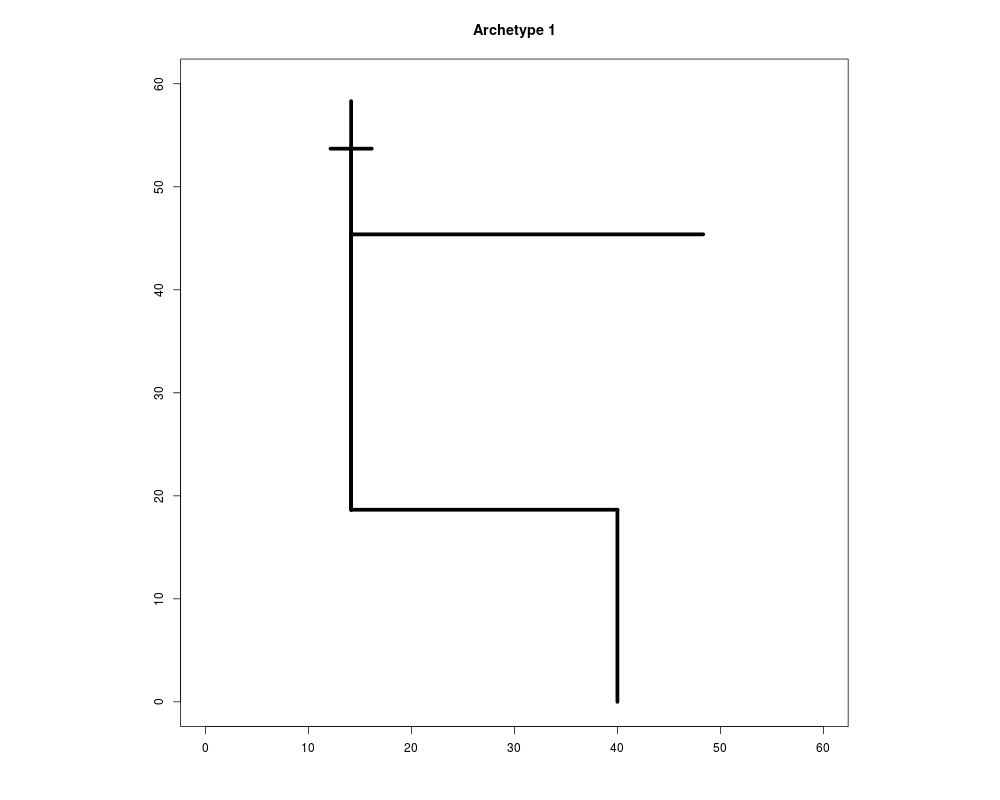
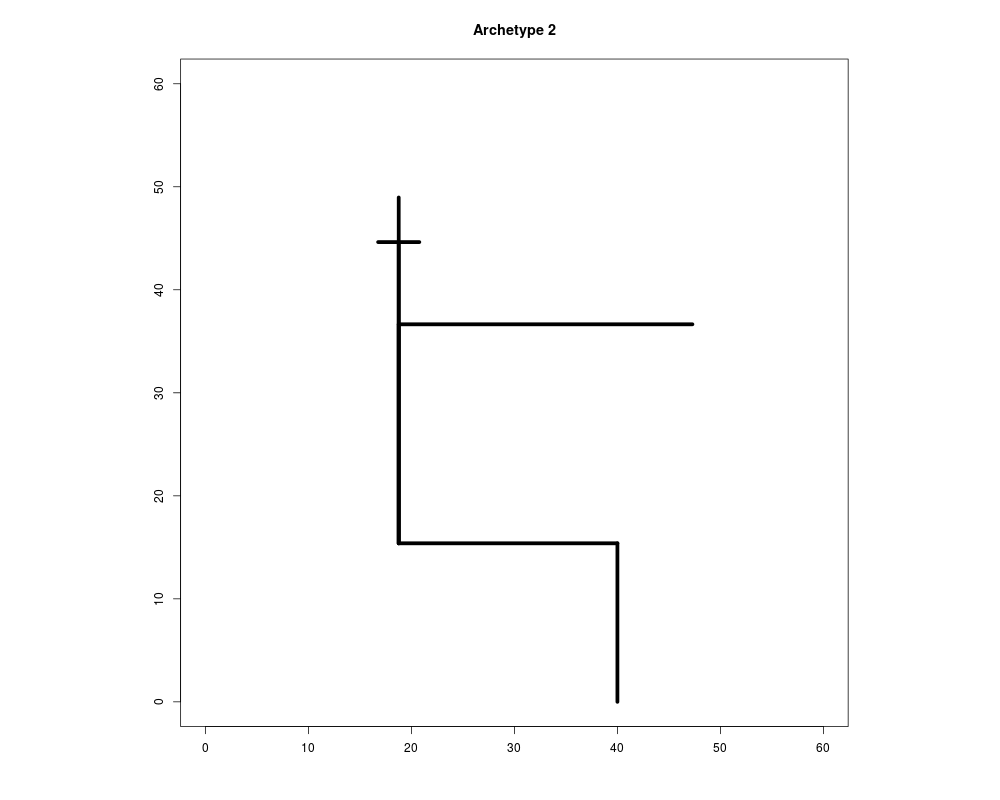
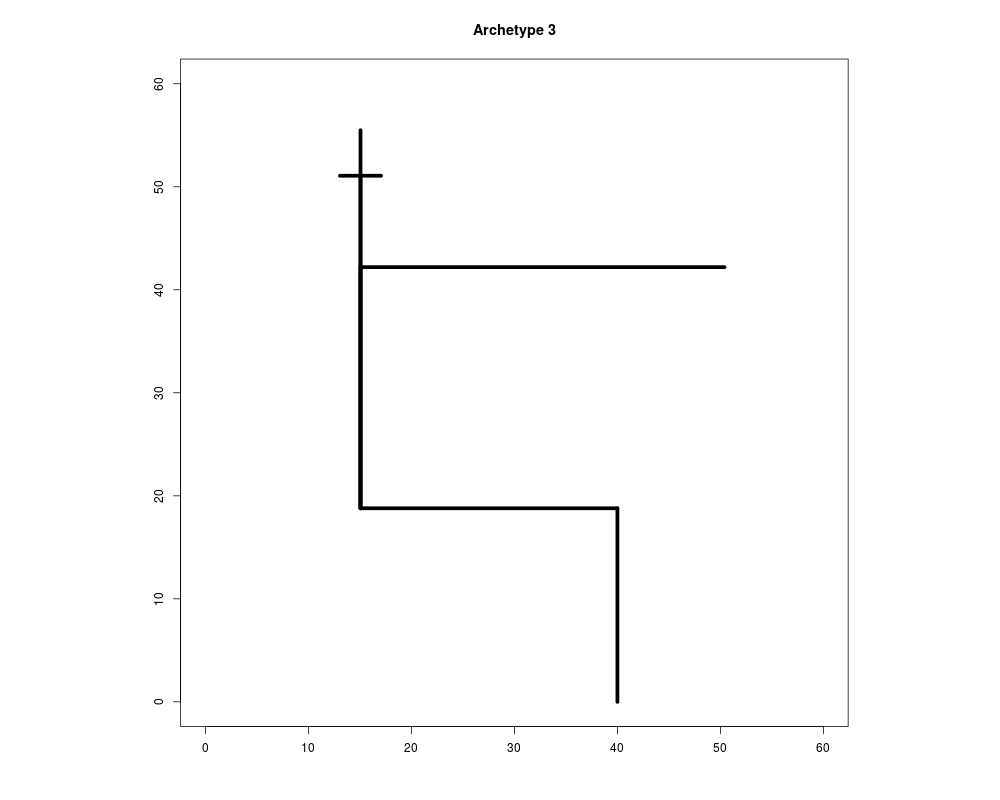
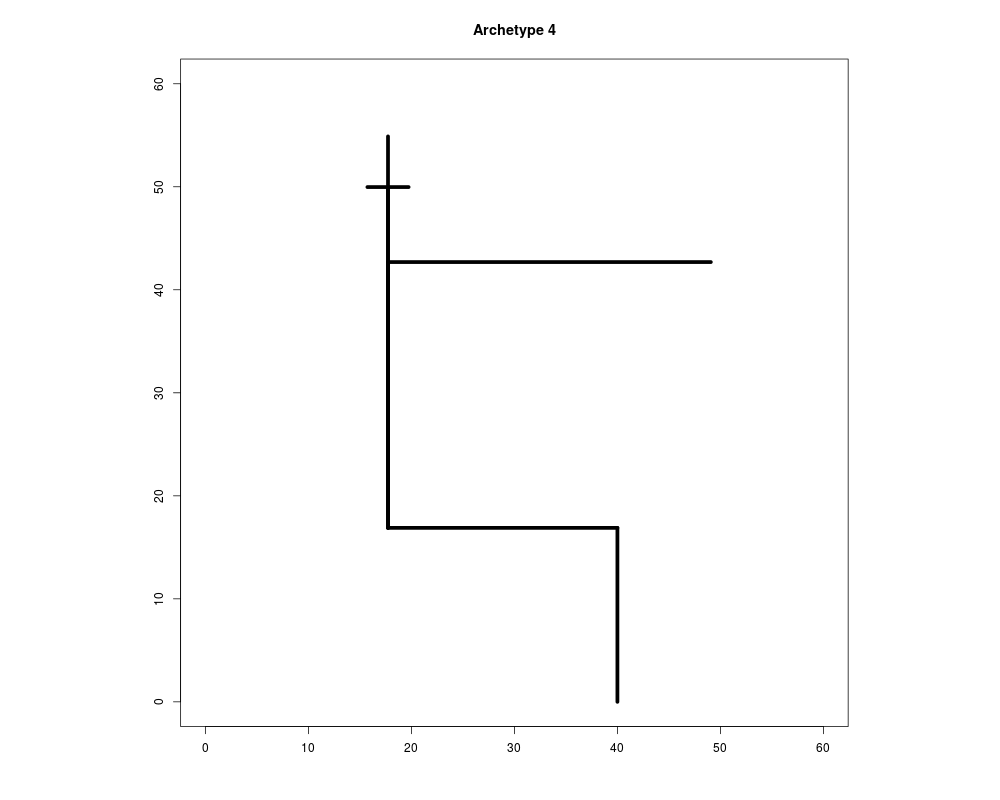
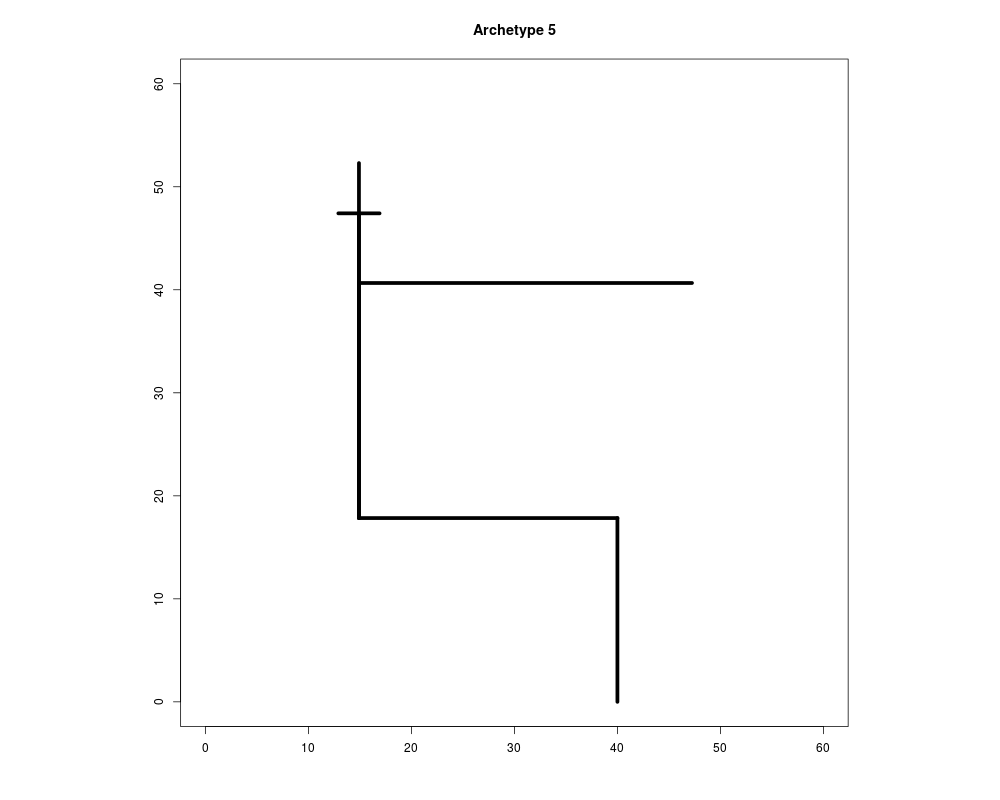
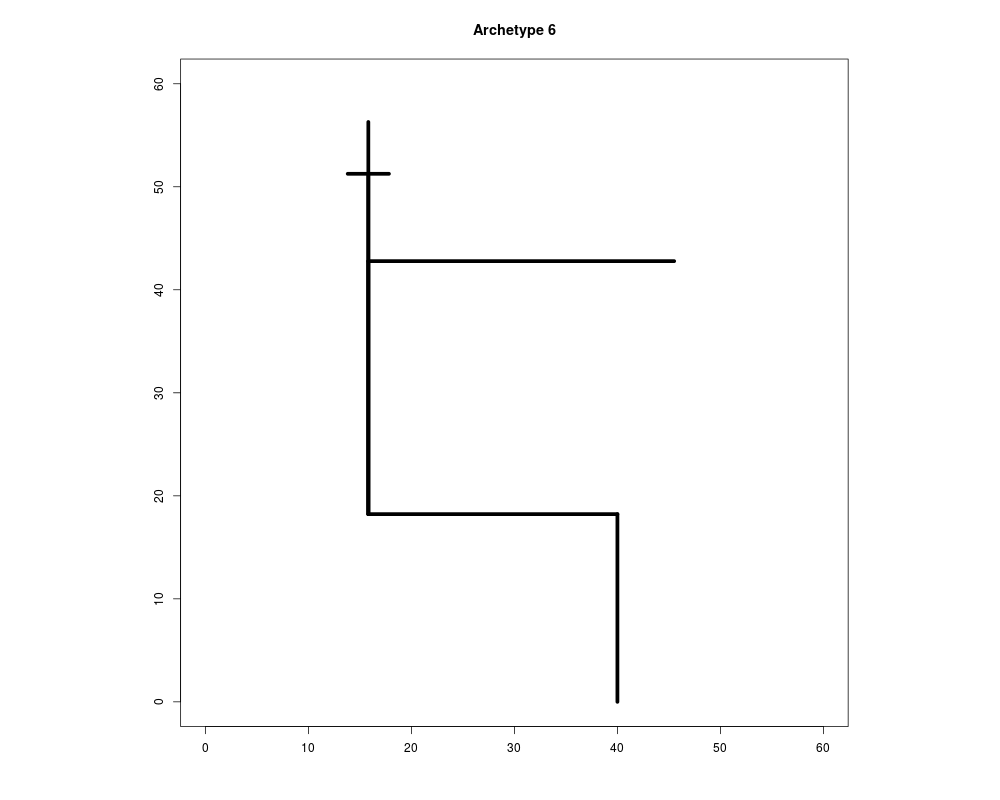
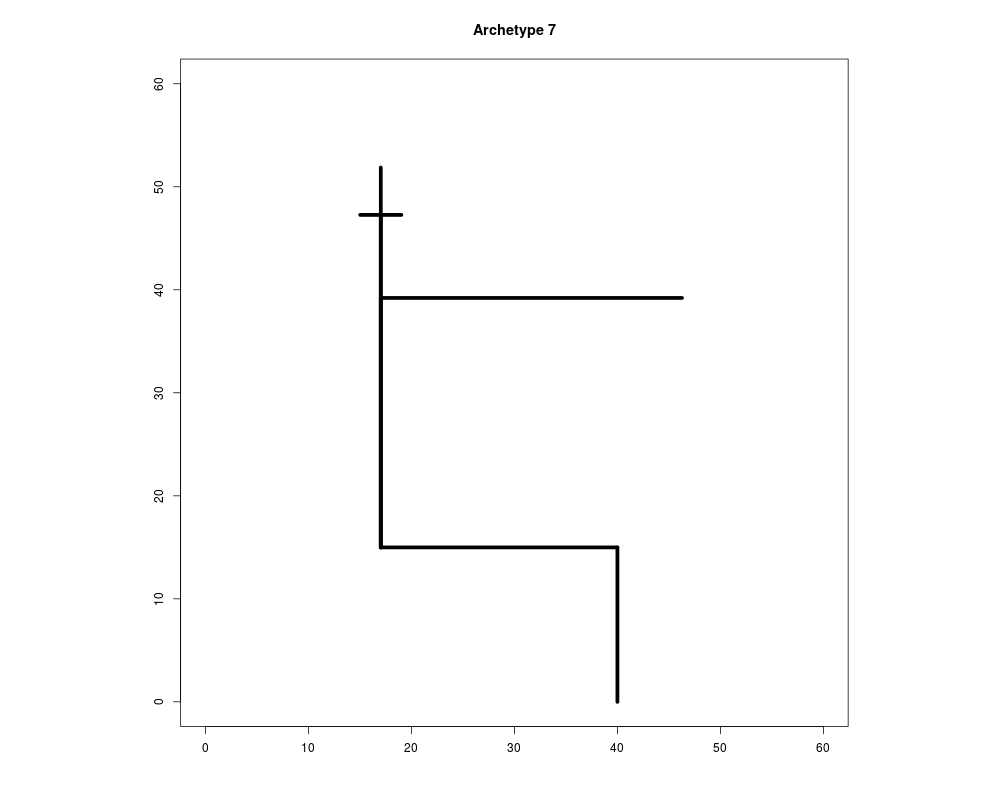
Skeleton plot of archetypal individualsDescriptionThis function represents the skeleton plots of the archetypal observations (archetypes and archetypoids) of UsageskeletonsArchetypal(measuArch,main) Arguments
ValueA device with the desired plot. NoteThis function allows us to reproduce the archetypes of Figure 5 of Epifanio et al. (2013), see Author(s)Guillermo Vinue ReferencesEpifanio, I., Vinue, G., and Alemany, S., (2013). Archetypal analysis: contributions for estimating boundary cases in multivariate accommodation problem, Computers & Industrial Engineering 64, 757–765. See Also
Examples
#List with the measurements of each archetype (Table 7 of Epifanio et al (2013)):
lista_arch <- list()
lista_arch[[1]] <- c(34.18, 25.85, 18.65, 39.66, 35.05, 26.73)
lista_arch[[2]] <- c(28.51, 21.23, 15.39, 33.57, 29.24, 21.26)
lista_arch[[3]] <- c(35.34, 24.94, 18.79, 36.7, 32.28, 23.41)
lista_arch[[4]] <- c(31.34, 22.27, 16.89, 38, 33.08, 25.8)
lista_arch[[5]] <- c(32.33, 25.09, 17.84, 34.46, 29.58, 22.82)
lista_arch[[6]] <- c(29.69, 24.18, 18.22, 38.07, 33.04, 24.56)
lista_arch[[7]] <- c(29.24, 22.97, 14.99, 36.88, 32.28, 24.22)

for(i in 1:length(lista_arch)){
 titlePlot <- paste("Archetype", i, sep = " ")
 skeletonsArchetypal(lista_arch[[i]],titlePlot)
}

#Note: For an example for archetypoids, see www.uv.es/vivigui/softw/more_examples.R
Results
R version 3.3.1 (2016-06-21) -- "Bug in Your Hair"
Copyright (C) 2016 The R Foundation for Statistical Computing
Platform: x86_64-pc-linux-gnu (64-bit)

R is free software and comes with ABSOLUTELY NO WARRANTY.
You are welcome to redistribute it under certain conditions.
Type 'license()' or 'licence()' for distribution details.

R is a collaborative project with many contributors.
Type 'contributors()' for more information and
'citation()' on how to cite R or R packages in publications.

Type 'demo()' for some demos, 'help()' for on-line help, or
'help.start()' for an HTML browser interface to help.
Type 'q()' to quit R.

> library(Anthropometry)
> png(filename="/home/ddbj/snapshot/RGM3/R_CC/result/Anthropometry/skeletonsArchetypal.Rd_%03d_medium.png", width=480, height=480)
> ### Name: skeletonsArchetypal
> ### Title: Skeleton plot of archetypal individuals
> ### Aliases: skeletonsArchetypal
> ### Keywords: array
>
> ### ** Examples
>
> #List with the measurements of each archetype (Table 7 of Epifanio et al (2013)):
> lista_arch <- list()
> lista_arch[[1]] <- c(34.18, 25.85, 18.65, 39.66, 35.05, 26.73)
> lista_arch[[2]] <- c(28.51, 21.23, 15.39, 33.57, 29.24, 21.26)
> lista_arch[[3]] <- c(35.34, 24.94, 18.79, 36.7, 32.28, 23.41)
> lista_arch[[4]] <- c(31.34, 22.27, 16.89, 38, 33.08, 25.8)
> lista_arch[[5]] <- c(32.33, 25.09, 17.84, 34.46, 29.58, 22.82)
> lista_arch[[6]] <- c(29.69, 24.18, 18.22, 38.07, 33.04, 24.56)
> lista_arch[[7]] <- c(29.24, 22.97, 14.99, 36.88, 32.28, 24.22)
>
> for(i in 1:length(lista_arch)){
+  titlePlot <- paste("Archetype", i, sep = " ")
+  skeletonsArchetypal(lista_arch[[i]],titlePlot)
+ }
>
> #Note: For an example for archetypoids, see www.uv.es/vivigui/softw/more_examples.R
>
>
>
>
>
> dev.off()
null device
          1
>
|
Created & Maintained by Osamu Ogasawara (osamu.ogasawara@gmail.com) and 