Supported by Dr. Osamu Ogasawara and  . . |
|
Last data update: 2014.03.03 |
PC scores for archetypesDescriptionThis function is a small modification of the generic ValueA device with the desired plot. NoteThere are no usage and arguments sections in this help file because they are the same than those of the page 25 of the reference manual of archetypes. Author(s)Irene Epifanio ReferencesEpifanio, I., Vinue, G., and Alemany, S., (2013). Archetypal analysis: contributions for estimating boundary cases in multivariate accommodation problem, Computers & Industrial Engineering 64, 757–765. See Also
Examples
#First,the USAF 1967 database is read and preprocessed (Zehner et al. (1993)).
#Variable selection:
variabl_sel <- c(48, 40, 39, 33, 34, 36)
#Changing to inches:
USAFSurvey_inch <- USAFSurvey[1:25, variabl_sel] / (10 * 2.54)
#Data preprocessing:
USAFSurvey_preproc <- preprocessing(USAFSurvey_inch, TRUE, 0.95, TRUE)
#Procedure and results shown in section 2.2.2 and section 3.1:
set.seed(2010)
res <- archetypesBoundary(USAFSurvey_preproc$data, 15, FALSE, 3)
#To understand the warning messages, see the vignette of the
#archetypes package.
a3 <- archetypes::bestModel(res[[3]])
a7 <- archetypes::bestModel(res[[7]])
pznueva <- prcomp(USAFSurvey_preproc$data, scale = TRUE, retx = TRUE)
#PCA scores for 3 archetypes:
p3 <- predict(pznueva,archetypes::parameters(a3))
#PCA scores for 7 archetypes:
p7 <- predict(pznueva,archetypes::parameters(a7))
#Representing the scores:
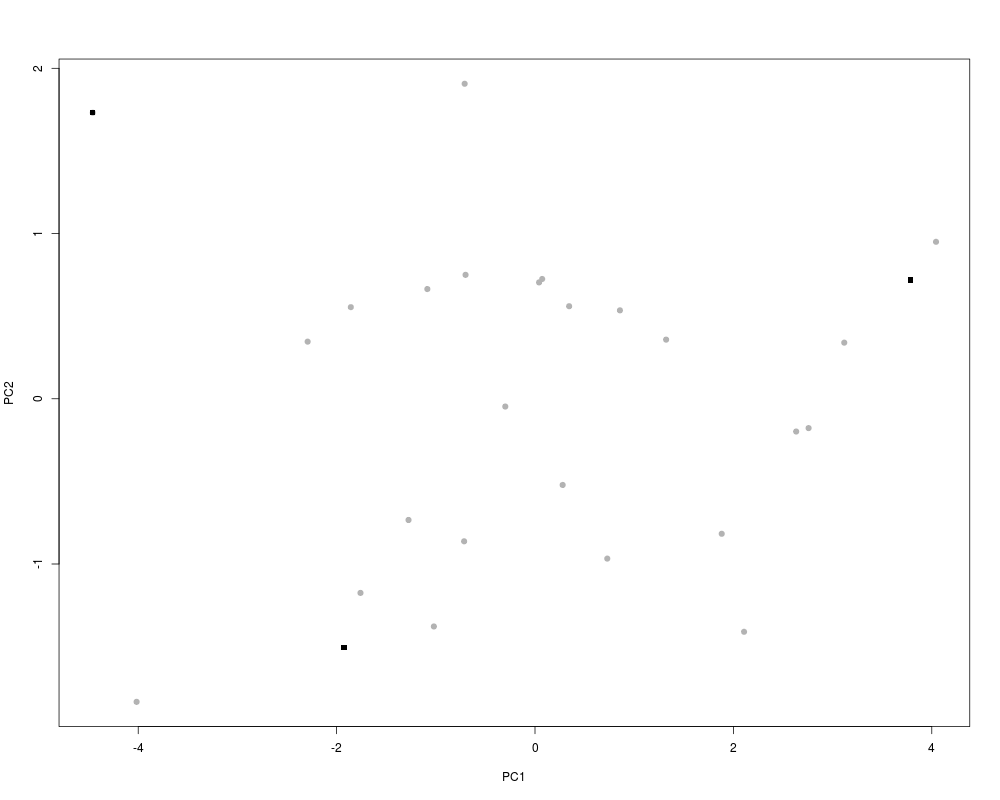
#Figure 4 (a):
xyplotPCArchetypes(p3[,1:2], pznueva$x[,1:2], data.col = gray(0.7),
atypes.col = 1, atypes.pch = 15)
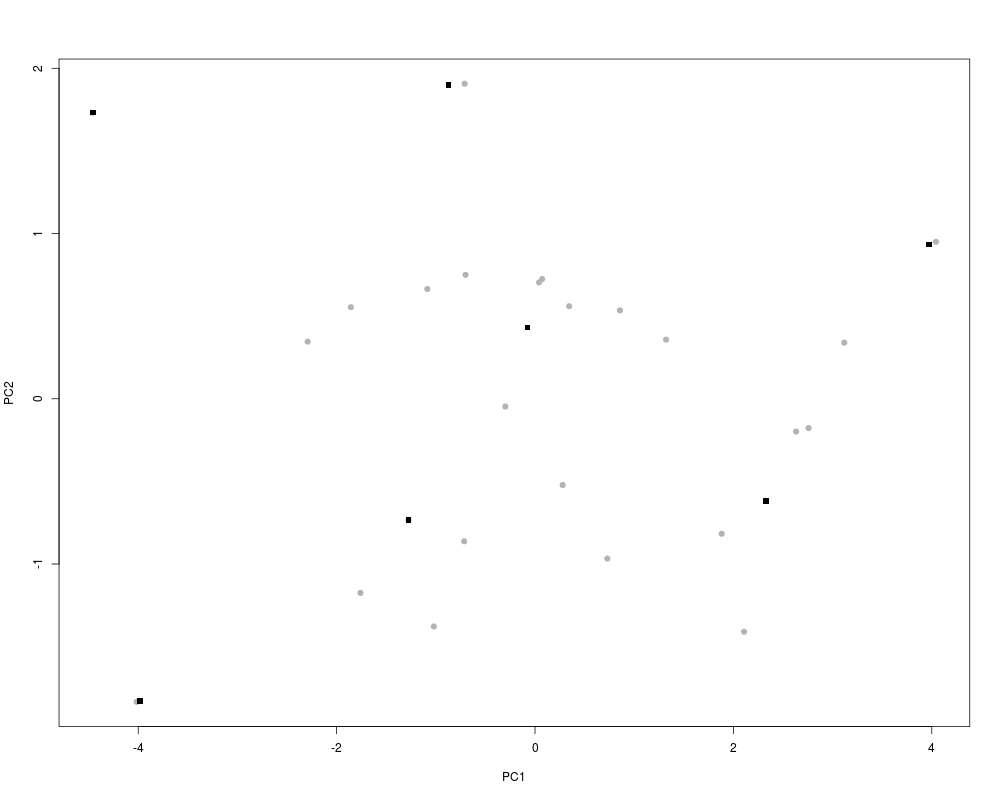
#Figure 4 (b):
xyplotPCArchetypes(p7[,1:2], pznueva$x[,1:2], data.col = gray(0.7),
atypes.col = 1, atypes.pch = 15)
Results
R version 3.3.1 (2016-06-21) -- "Bug in Your Hair"
Copyright (C) 2016 The R Foundation for Statistical Computing
Platform: x86_64-pc-linux-gnu (64-bit)

R is free software and comes with ABSOLUTELY NO WARRANTY.
You are welcome to redistribute it under certain conditions.
Type 'license()' or 'licence()' for distribution details.

R is a collaborative project with many contributors.
Type 'contributors()' for more information and
'citation()' on how to cite R or R packages in publications.

Type 'demo()' for some demos, 'help()' for on-line help, or
'help.start()' for an HTML browser interface to help.
Type 'q()' to quit R.

> library(Anthropometry)
> png(filename="/home/ddbj/snapshot/RGM3/R_CC/result/Anthropometry/xyplotPCArchetypes.Rd_%03d_medium.png", width=480, height=480)
> ### Name: xyplotPCArchetypes
> ### Title: PC scores for archetypes
> ### Aliases: xyplotPCArchetypes
> ### Keywords: array
>
> ### ** Examples
>
> #First,the USAF 1967 database is read and preprocessed (Zehner et al. (1993)).
> #Variable selection:
> variabl_sel <- c(48, 40, 39, 33, 34, 36)
> #Changing to inches:
> USAFSurvey_inch <- USAFSurvey[1:25, variabl_sel] / (10 * 2.54)
>
> #Data preprocessing:
> USAFSurvey_preproc <- preprocessing(USAFSurvey_inch, TRUE, 0.95, TRUE)
[1] "The percentage of accommodation is exactly 100%"
>
> #Procedure and results shown in section 2.2.2 and section 3.1:
> set.seed(2010)
> res <- archetypesBoundary(USAFSurvey_preproc$data, 15, FALSE, 3)
There were 32 warnings (use warnings() to see them)
> #To understand the warning messages, see the vignette of the
> #archetypes package.
>
> a3 <- archetypes::bestModel(res[[3]])
> a7 <- archetypes::bestModel(res[[7]])
>
> pznueva <- prcomp(USAFSurvey_preproc$data, scale = TRUE, retx = TRUE)
> #PCA scores for 3 archetypes:
> p3 <- predict(pznueva,archetypes::parameters(a3))
> #PCA scores for 7 archetypes:
> p7 <- predict(pznueva,archetypes::parameters(a7))
> #Representing the scores:
> #Figure 4 (a):
> xyplotPCArchetypes(p3[,1:2], pznueva$x[,1:2], data.col = gray(0.7),
+                    atypes.col = 1, atypes.pch = 15)
> #Figure 4 (b):
> xyplotPCArchetypes(p7[,1:2], pznueva$x[,1:2], data.col = gray(0.7),
+                    atypes.col = 1, atypes.pch = 15)
>
>
>
>
>
> dev.off()
null device
          1
>
|