The http://fueleconomy.gov website, run by the U.S. Department of Energy's Office of Energy Efficiency and Renewable Energy and the U.S. Environmental Protection Agency, lists different estimates of fuel economy for passenger cars and trucks. For each vehicle, various characteristics are recorded such as the engine displacement or number of cylinders. Along with these values, laboratory measurements are made for the city and highway miles per gallon (MPG) of the car.
Predictors extracted from the website include: EngDispl, NumCyl, Transmission, AirAspirationMethod, NumGears, TransLockup, TransCreeperGear, DriveDesc, IntakeValvePerCyl, ExhaustValvesPerCyl, CarlineClassDesc, VarValveTiming and VarValveLift. The outcome used in the book is in column FE and is the unadjusted highway data.
Usage
data(FuelEconomy)
Value
cars2010
data in cars from model year 2010.
cars2011
cars introduced in 2011 that were not in the model year 2010 data.
cars2012
cars introduced in 2012 that were not in the model year 2010 or 2011 data
R version 3.3.1 (2016-06-21) -- "Bug in Your Hair"
Copyright (C) 2016 The R Foundation for Statistical Computing
Platform: x86_64-pc-linux-gnu (64-bit)
R is free software and comes with ABSOLUTELY NO WARRANTY.
You are welcome to redistribute it under certain conditions.
Type 'license()' or 'licence()' for distribution details.
R is a collaborative project with many contributors.
Type 'contributors()' for more information and
'citation()' on how to cite R or R packages in publications.
Type 'demo()' for some demos, 'help()' for on-line help, or
'help.start()' for an HTML browser interface to help.
Type 'q()' to quit R.
> library(AppliedPredictiveModeling)
> png(filename="/home/ddbj/snapshot/RGM3/R_CC/result/AppliedPredictiveModeling/FuelEconomy.Rd_%03d_medium.png", width=480, height=480)
> ### Name: FuelEconomy
> ### Title: Fuel Economy Data
> ### Aliases: cars2010 cars2011 cars2012
> ### Keywords: datasets
>
> ### ** Examples
>
> data(FuelEconomy)
>
> library(lattice)
>
> ### Plot shown in the text:
>
> cars2010 <- cars2010[order(cars2010$EngDispl),]
> cars2011 <- cars2011[order(cars2011$EngDispl),]
>
> cars2010a <- cars2010
> cars2010a$Year <- "2010 Model Year"
> cars2011a <- cars2011
> cars2011a$Year <- "2011 Model Year"
>
> plotData <- rbind(cars2010a, cars2011a)
>
> plotTheme <- bookTheme(FALSE)
> plotTheme$plot.symbol$col <- rgb(.2, .2, .2, .5)
> plotTheme$plot.symbol$cex <- 0.7
> trellis.par.set(plotTheme)
>
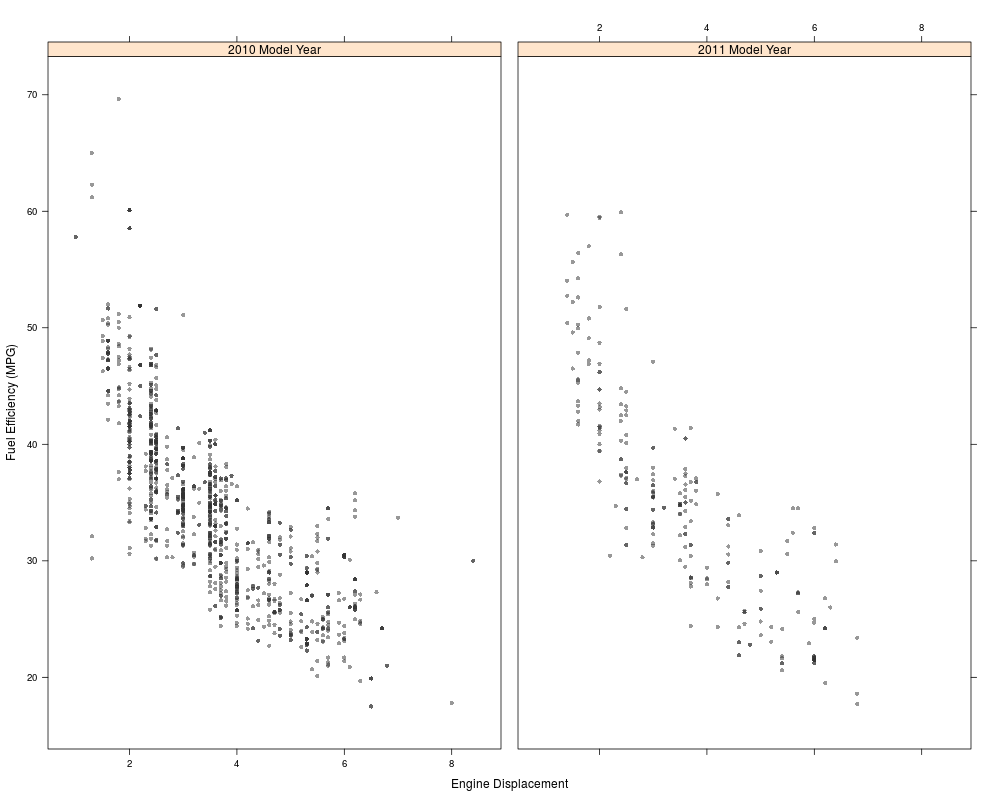
> xyplot(FE ~ EngDispl|Year, plotData,
+ xlab = "Engine Displacement",
+ ylab = "Fuel Efficiency (MPG)",
+ between = list(x = 1.2))
>
>
>
>
>
>
> dev.off()
null device
1
>
 .
.