Supported by Dr. Osamu Ogasawara and  . . |
|
Last data update: 2014.03.03 |
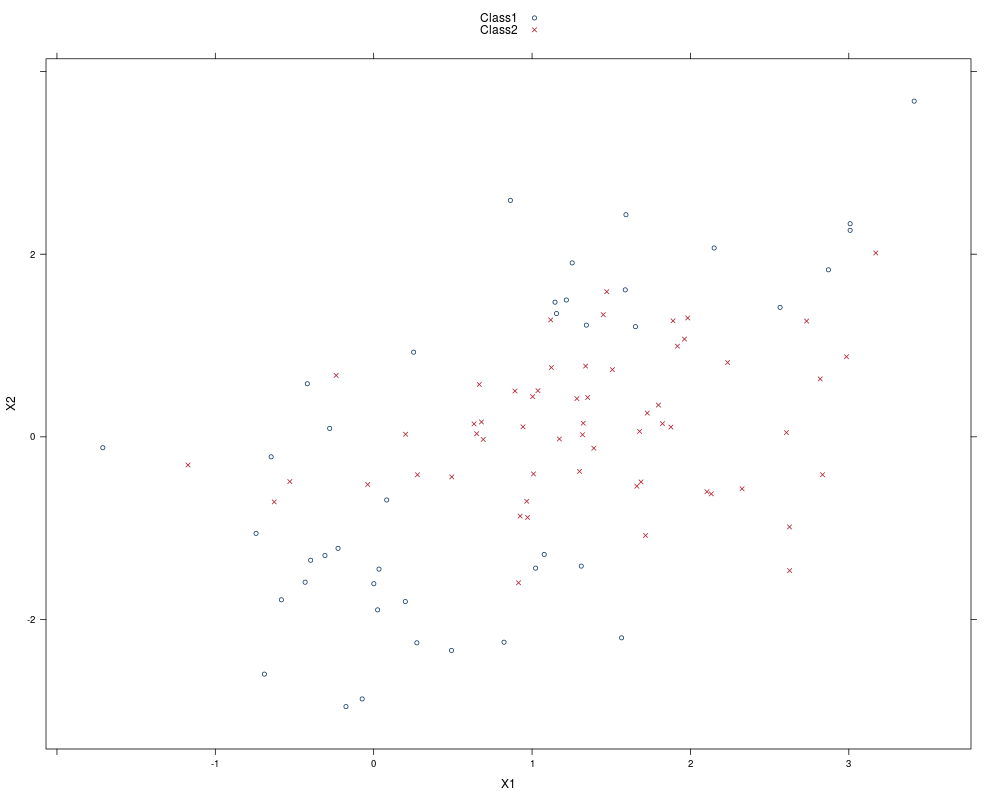
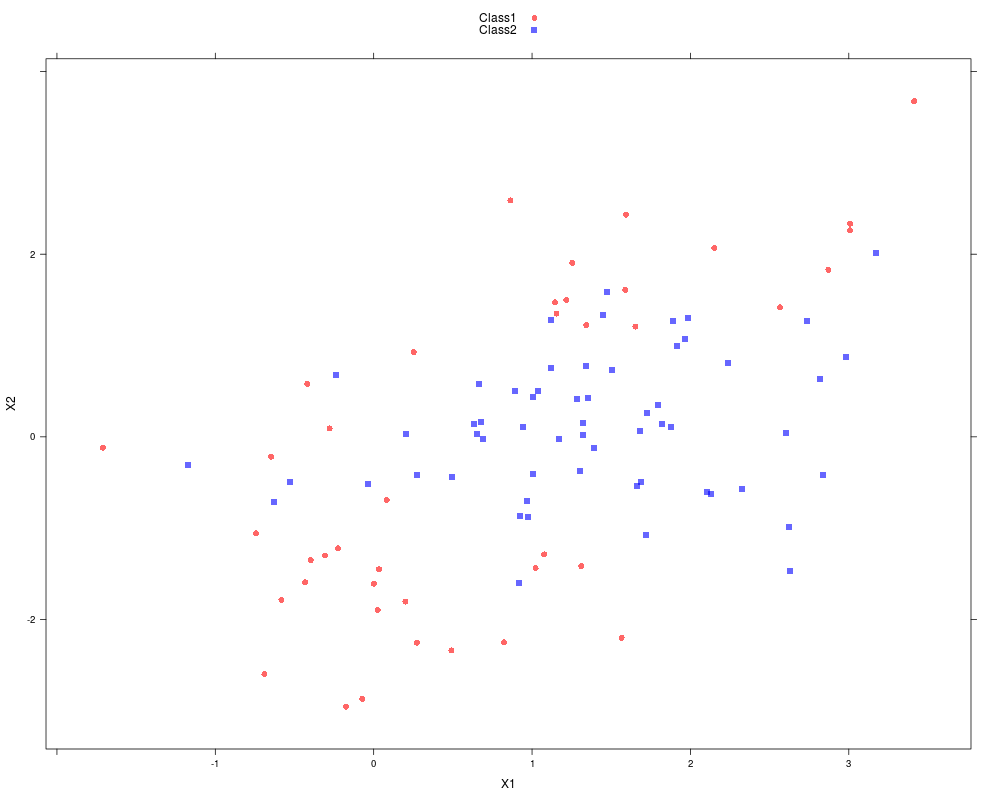
Lattice ThemesDescriptionTwo lattice themes used throughout the book. UsagebookTheme(set = TRUE) transparentTheme(set = TRUE, pchSize = 1, trans = 0.2) Arguments
DetailsWhen using these functions to save a plot, make sure to invoke them after the device has been opened (e.g. after calls such as ValueEach function returns a list of theme parameters. See Sarkar (2008) or Author(s)Max Kuhn ReferencesSome of the colors are based on values from ColorBrewer http://www.colorbrewer.org. Sarkar, D. (2008). Lattice: Multivariate Data Visualization with R. UseR! (1st ed. p. 286). Springer. Exampleslibrary(lattice) example <- quadBoundaryFunc(100) bookTheme(set = TRUE) xyplot(X2 ~ X1, data = example, groups = class, auto.key = TRUE) transparentTheme(set = TRUE, trans = .6) xyplot(X2 ~ X1, data = example, groups = class, auto.key = TRUE) Results
R version 3.3.1 (2016-06-21) -- "Bug in Your Hair"
Copyright (C) 2016 The R Foundation for Statistical Computing
Platform: x86_64-pc-linux-gnu (64-bit)

R is free software and comes with ABSOLUTELY NO WARRANTY.
You are welcome to redistribute it under certain conditions.
Type 'license()' or 'licence()' for distribution details.

R is a collaborative project with many contributors.
Type 'contributors()' for more information and
'citation()' on how to cite R or R packages in publications.

Type 'demo()' for some demos, 'help()' for on-line help, or
'help.start()' for an HTML browser interface to help.
Type 'q()' to quit R.

> library(AppliedPredictiveModeling)
> png(filename="/home/ddbj/snapshot/RGM3/R_CC/result/AppliedPredictiveModeling/bookTheme.Rd_%03d_medium.png", width=480, height=480)
> ### Name: bookTheme
> ### Title: Lattice Themes
> ### Aliases: bookTheme transparentTheme
> ### Keywords: hplot
>
> ### ** Examples
>
> library(lattice)
>
> example <- quadBoundaryFunc(100)
>
> bookTheme(set = TRUE)
> xyplot(X2 ~ X1, data = example, groups = class, auto.key = TRUE)
>
> transparentTheme(set = TRUE, trans = .6)
> xyplot(X2 ~ X1, data = example, groups = class, auto.key = TRUE)
>
>
>
>
>
> dev.off()
null device
          1
>
|
Created & Maintained by Osamu Ogasawara (osamu.ogasawara@gmail.com) and 