R version 3.3.1 (2016-06-21) -- "Bug in Your Hair"
Copyright (C) 2016 The R Foundation for Statistical Computing
Platform: x86_64-pc-linux-gnu (64-bit)
R is free software and comes with ABSOLUTELY NO WARRANTY.
You are welcome to redistribute it under certain conditions.
Type 'license()' or 'licence()' for distribution details.
R is a collaborative project with many contributors.
Type 'contributors()' for more information and
'citation()' on how to cite R or R packages in publications.
Type 'demo()' for some demos, 'help()' for on-line help, or
'help.start()' for an HTML browser interface to help.
Type 'q()' to quit R.
> library(ArArRedux)
> png(filename="/home/ddbj/snapshot/RGM3/R_CC/result/ArArRedux/plot.Rd_%03d_medium.png", width=480, height=480)
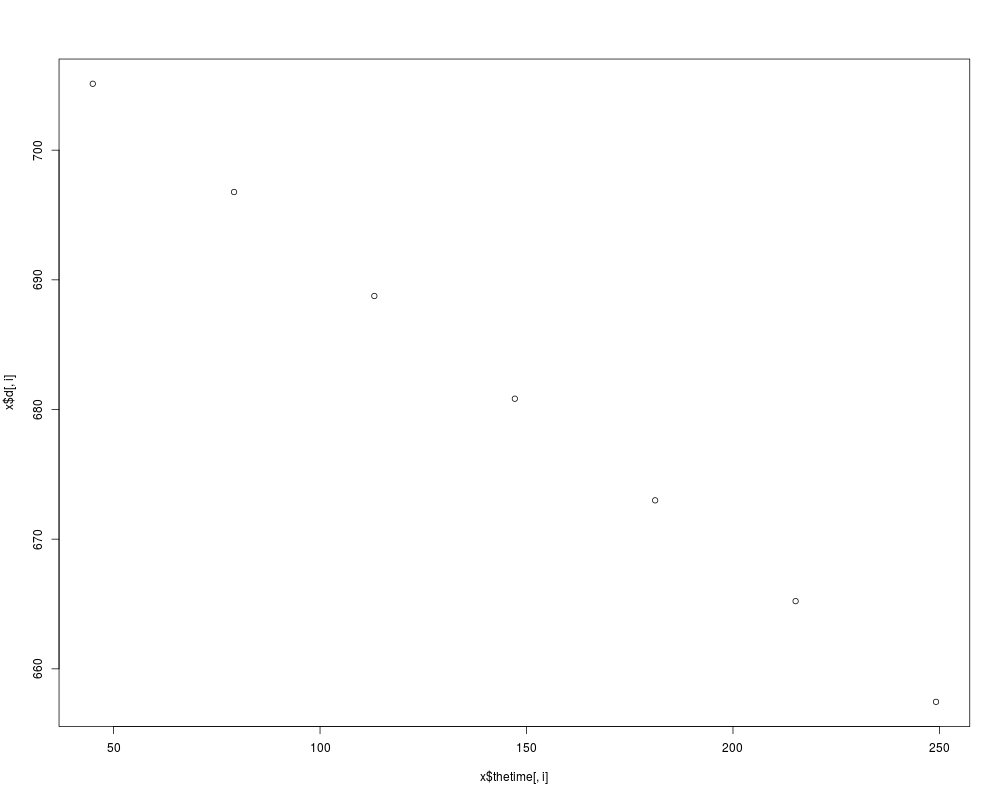
> ### Name: plot.timeresolved
> ### Title: Plot a time resolved mass spectrometry signal
> ### Aliases: plot.PHdata plot.timeresolved
>
> ### ** Examples
>
> samplefile <- system.file("Samples.csv",package="ArArRedux")
> masses <- c("Ar37","Ar38","Ar39","Ar40","Ar36")
> mMC <- loaddata(samplefile,masses)
> plot(mMC,"MD2-1a","Ar40")
> mPH <- loaddata(samplefile,masses,PH=TRUE)
> plot(mPH,"MD2-1a","Ar40")
>
>
>
>
>
> dev.off()
null device
1
>
 .
.