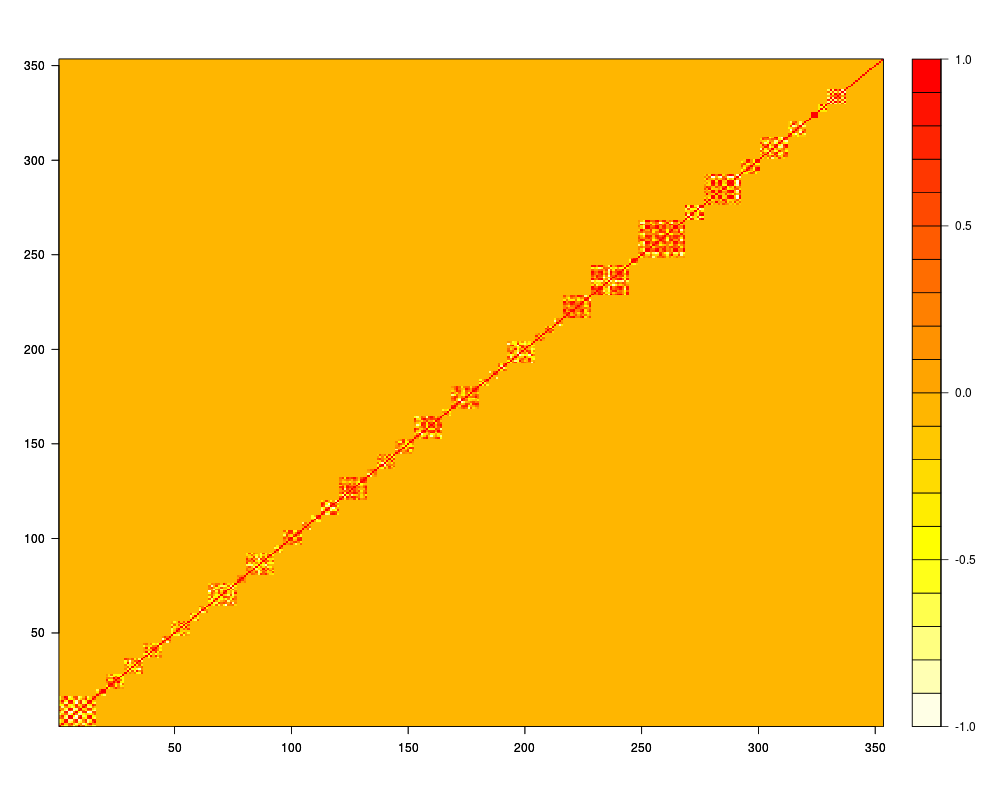
Converts the covariance matrix to a correlation matrix and plots
this is a coloured image for visual inspection.
Usage
plotcorr(X)
Arguments
X
a data structure (list) containing an item called ‘covmat’ (covariance matrix)
Examples
data(Melbourne)
plotcorr(Melbourne$X)
Results
R version 3.3.1 (2016-06-21) -- "Bug in Your Hair"
Copyright (C) 2016 The R Foundation for Statistical Computing
Platform: x86_64-pc-linux-gnu (64-bit)

R is free software and comes with ABSOLUTELY NO WARRANTY.
You are welcome to redistribute it under certain conditions.
Type 'license()' or 'licence()' for distribution details.

R is a collaborative project with many contributors.
Type 'contributors()' for more information and
'citation()' on how to cite R or R packages in publications.

Type 'demo()' for some demos, 'help()' for on-line help, or
'help.start()' for an HTML browser interface to help.
Type 'q()' to quit R.

> library(ArArRedux)
> png(filename="/home/ddbj/snapshot/RGM3/R_CC/result/ArArRedux/plotcorr.Rd_%03d_medium.png", width=480, height=480)
> ### Name: plotcorr
> ### Title: Plot a matrix with correlation coefficients
> ### Aliases: plotcorr
>
> ### ** Examples
>
> data(Melbourne)
> plotcorr(Melbourne$X)
>
>
>
>
>
> dev.off()
null device
          1
>
 .
.