Supported by Dr. Osamu Ogasawara and  . . |
|
Last data update: 2014.03.03 |
Regression Analysis for Time-Dependent CoefficientsDescriptionEstimation of regression models for sparse asynchronous longitudinal observations with time-dependent coefficients. UsageasynchTD(data.x, data.y, times, kType = "epan", lType = "identity",
bw=NULL, nCores = 1, ...)
Arguments
DetailsFor lType = "log" and lType = "logistic", parameter estimates are obtained by minimizing the estimating equation using optim() with method="Nelder-Mead"; all other arguments take their default values. For lType = "identity", parameter estimates are obtained using solve(). Upon completion, a single plot is generating showing the time-dependence of each coefficient. ValueA list is returned. Each element of the list is a matrix, where the ith row corresponds to the ith time point of input argument “times" and the columns correspond to the model parameters. The returned values are estimated using either the provided bandwidth or the “optimal" bandwidth as determined using the adaptive selection procedure.
If the bandwidth is determined automatically, two additional list elements are returned:
Author(s)Hongyuan Cao, Donglin Zeng, Jason P. Fine, and Shannon T. Holloway ReferencesCao, H., Zeng, D., and Fine, J. P. (2014) Regression Analysis of sparse asynchronous longitudinal data. Journal of the Royal Statistical Society: Series B, 77, 755-776. Examples
  data(asynchDataTD)

  res <- asynchTD(data.x = TD.x,
                  data.y = TD.y,
                  times = c(0.25, 0.50, 0.75),
                  bw = 0.05,
                  kType = "epan",
                  lType = "identity")
Results
R version 3.3.1 (2016-06-21) -- "Bug in Your Hair"
Copyright (C) 2016 The R Foundation for Statistical Computing
Platform: x86_64-pc-linux-gnu (64-bit)
R is free software and comes with ABSOLUTELY NO WARRANTY.
You are welcome to redistribute it under certain conditions.
Type 'license()' or 'licence()' for distribution details.
R is a collaborative project with many contributors.
Type 'contributors()' for more information and
'citation()' on how to cite R or R packages in publications.
Type 'demo()' for some demos, 'help()' for on-line help, or
'help.start()' for an HTML browser interface to help.
Type 'q()' to quit R.
> library(AsynchLong)
Loading required package: compiler
Loading required package: parallel
AsynchLong was developed in support of IMPACT, a comprehensive research
program that aims to improve the health and longevity of people by
improving the clinical trial process. To learn more about our
research and available software visit www.impact.unc.edu.
> png(filename="/home/ddbj/snapshot/RGM3/R_CC/result/AsynchLong/asynchTD.Rd_%03d_medium.png", width=480, height=480)
> ### Name: asynchTD
> ### Title: Regression Analysis for Time-Dependent Coefficients
> ### Aliases: asynchTD
>
> ### ** Examples
>
>
> data(asynchDataTD)
>
> res <- asynchTD(data.x = TD.x,
+ data.y = TD.y,
+ times = c(0.25, 0.50, 0.75),
+ bw = 0.05,
+ kType = "epan",
+ lType = "identity")
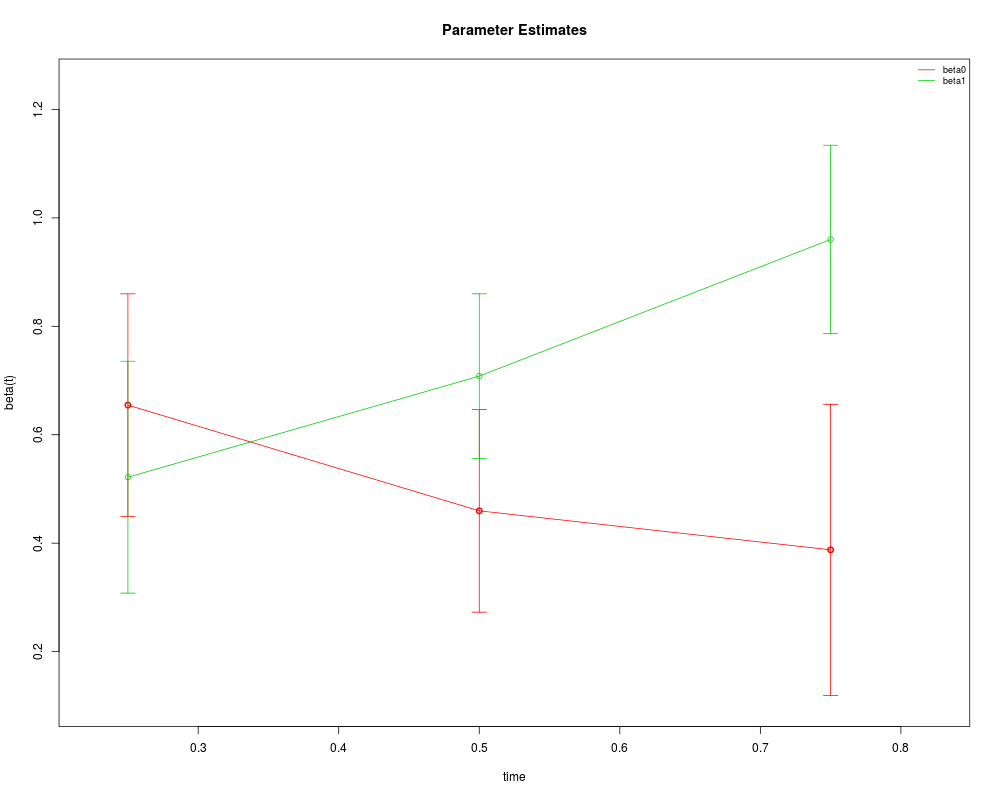
Time point: 0.25
Bandwidth: 0.05
estimate stdErr z-value p-value
beta0 0.6545948 0.1047513 6.249040 4.129827e-10
beta1 0.5216886 0.1091160 4.781047 1.743847e-06
Time point: 0.5
Bandwidth: 0.05
estimate stdErr z-value p-value
beta0 0.4595937 0.09531513 4.821833 1.422449e-06
beta1 0.7081564 0.07747553 9.140388 6.222894e-20
Time point: 0.75
Bandwidth: 0.05
estimate stdErr z-value p-value
beta0 0.3876471 0.13696196 2.830326 4.650054e-03
beta1 0.9602452 0.08867424 10.828908 2.511314e-27
>
>
>
>
>
>
>
> dev.off()
null device
1
>
|