Supported by Dr. Osamu Ogasawara and  . . |
|
Last data update: 2014.03.03 |
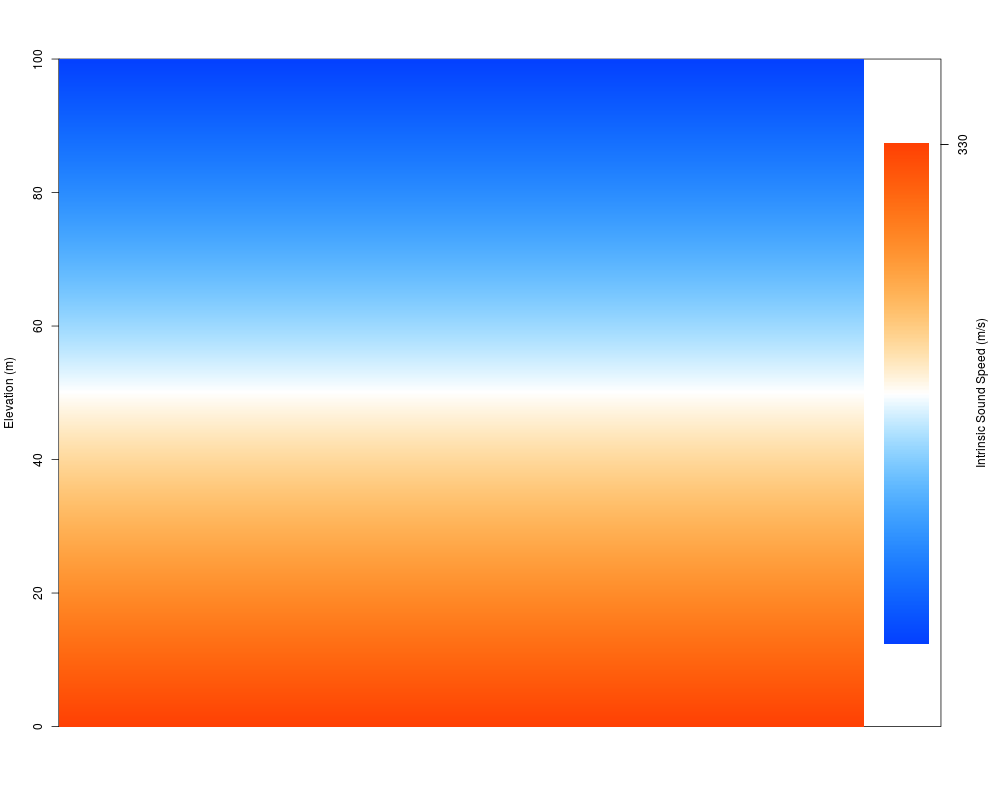
Plot Linear AtmosphereDescriptionMakes a plot showing effective sound speed structure. UsagePlotAtm.lin(ATM, zlim = c(0, 100), winddir = 90, col = sky.colors(500), TOPO = NULL) Arguments
DetailsWhen plotting topography, an east-west cross-section where TOPO$y is zero is plotted. TOPO should be formatted as a potential input to functions like 'contour' or 'image'. ValueNone; plot side effects only. Author(s)Jake Anderson ExamplesATM = CheckAtm.lin() PlotAtm.lin(ATM) Results
R version 3.3.1 (2016-06-21) -- "Bug in Your Hair"
Copyright (C) 2016 The R Foundation for Statistical Computing
Platform: x86_64-pc-linux-gnu (64-bit)

R is free software and comes with ABSOLUTELY NO WARRANTY.
You are welcome to redistribute it under certain conditions.
Type 'license()' or 'licence()' for distribution details.

R is a collaborative project with many contributors.
Type 'contributors()' for more information and
'citation()' on how to cite R or R packages in publications.

Type 'demo()' for some demos, 'help()' for on-line help, or
'help.start()' for an HTML browser interface to help.
Type 'q()' to quit R.

> library(AtmRay)
> png(filename="/home/ddbj/snapshot/RGM3/R_CC/result/AtmRay/PlotAtm.lin.Rd_%03d_medium.png", width=480, height=480)
> ### Name: PlotAtm.lin
> ### Title: Plot Linear Atmosphere
> ### Aliases: PlotAtm.lin
> ### Keywords: misc
>
> ### ** Examples
>
> ATM = CheckAtm.lin()
> PlotAtm.lin(ATM)
[1] 330 330
[1] 87.2 87.2
>
>
>
>
>
> dev.off()
null device
          1
>
|
Created & Maintained by Osamu Ogasawara (osamu.ogasawara@gmail.com) and 