R version 3.3.1 (2016-06-21) -- "Bug in Your Hair"
Copyright (C) 2016 The R Foundation for Statistical Computing
Platform: x86_64-pc-linux-gnu (64-bit)
R is free software and comes with ABSOLUTELY NO WARRANTY.
You are welcome to redistribute it under certain conditions.
Type 'license()' or 'licence()' for distribution details.
R is a collaborative project with many contributors.
Type 'contributors()' for more information and
'citation()' on how to cite R or R packages in publications.
Type 'demo()' for some demos, 'help()' for on-line help, or
'help.start()' for an HTML browser interface to help.
Type 'q()' to quit R.
> library(AutoModel)
> png(filename="/home/ddbj/snapshot/RGM3/R_CC/result/AutoModel/model_output.Rd_%03d_medium.png", width=480, height=480)
> ### Name: model_output
> ### Title: Multiple Regression Output
> ### Aliases: model_output
>
> ### ** Examples
>
> freeny_model_formulas <- create_formula_objects("y",
+ c("lag.quarterly.revenue"), c("price.index"))
> freeny_models <- create_model_objects(freeny_model_formulas,
+ dataset = freeny)
> freeny_model <- freeny_models[[length(freeny_models)]]
> checks <- assumptions_check(freeny_model)
> model_output(freeny_models, freeny, checks, freeny_model_formulas,
+ outliers = "significant")
REGRESSION OUTPUT
Durbin-Watson = 2.357 p value = 0.797
Partial Regression plots (all relationships should be linear):
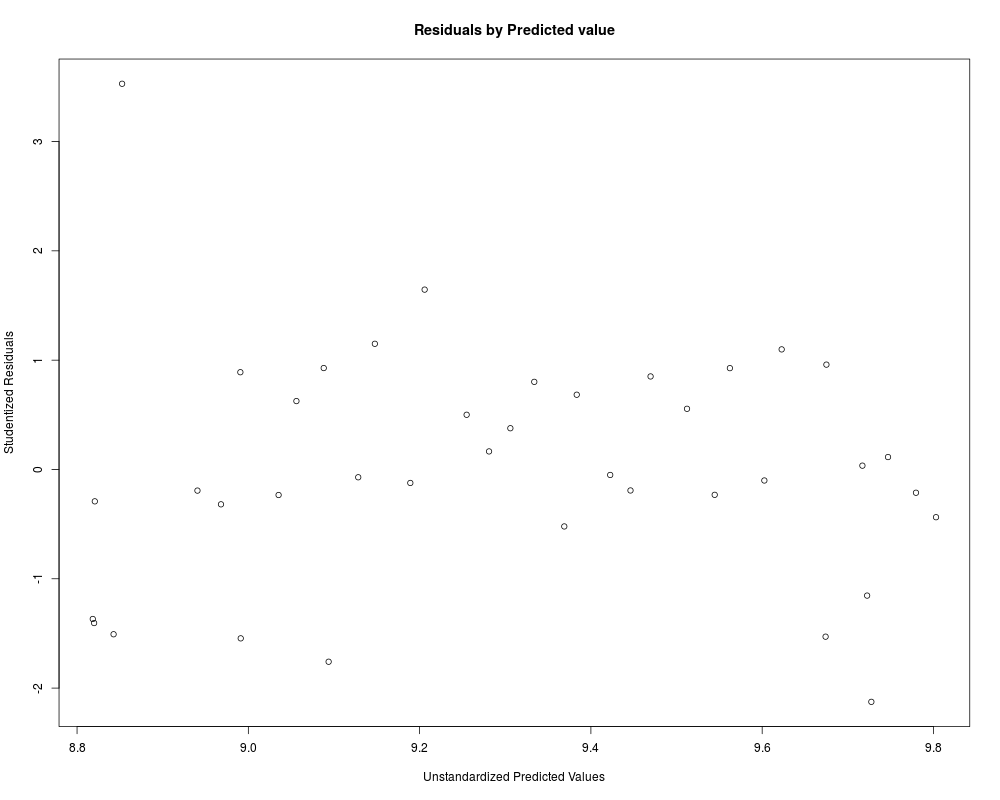
Plot of studentized residuals: uniform distibution across predicted values requiredCorrelation Matrix for model (correlation >.70 indicates severe multicollinearity)
y lag.quarterly.revenue price.index
y 1.0000 0.9978 -0.9895
lag.quarterly.revenue 0.9978 1.0000 -0.9894
price.index -0.9895 -0.9894 1.0000
Variance inflation factor (<10 desired):
lag.quarterly.revenue price.index
47.5 47.5
Standardized Residuals (observations > 3.00 problematic):
1963.25
3.073
Cook's distance (values >.2 problematic):
1963.25
1.169
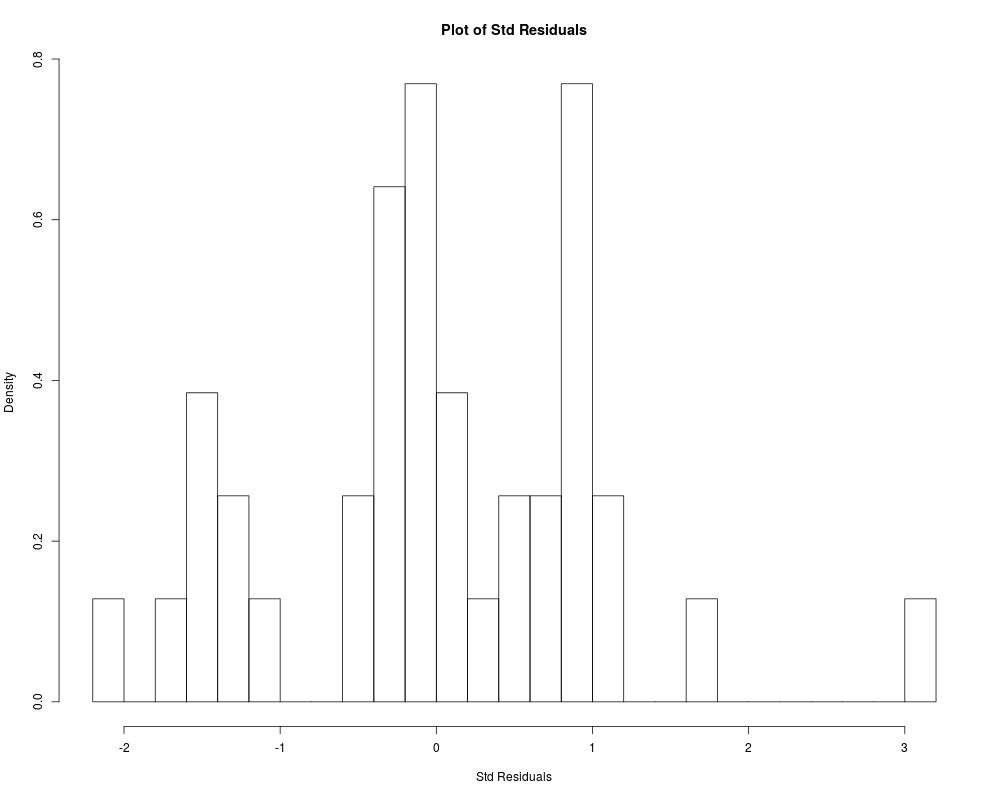
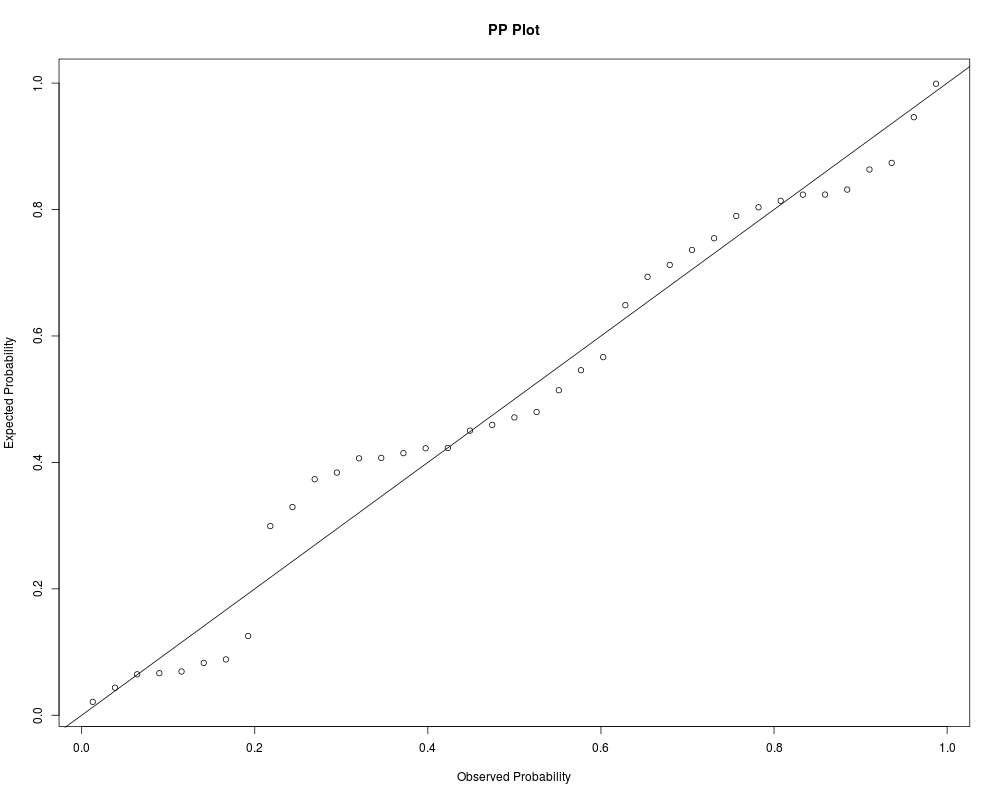
Normality of standardized model residuals: Shapiro-Wilk (p-value): 0.1296
Model change statistics
R R^2 Adj R^2 SE Est. Delta R^2 F Change df1 df2 p Fch Sig
Model 1 0.9978 0.9956 0.9955 0.0212 0.9956 8360.3793 1 37 0 ***
Model 2 0.9979 0.9958 0.9956 0.0209 0.0002 2.1304 1 36 0.1531
Model 1 : y ~ lag.quarterly.revenue
Model 2 : y ~ lag.quarterly.revenue + price.index
Model Coefficients
Model term estimate std.error statistic p.value sig
Model 1 (Intercept) 0.04169 0.10138 0.4112 0.6833
Model 1 lag.quarterly.revenue 0.99827 0.01092 91.4351 0.0000 ***
Model 2 (Intercept) 2.18577 1.47236 1.4845 0.1464
Model 2 lag.quarterly.revenue 0.89122 0.07412 12.0240 0.0000 ***
Model 2 price.index -0.25592 0.17534 -1.4596 0.1531
>
>
>
>
>
> dev.off()
null device
1
>
 .
.