Supported by Dr. Osamu Ogasawara and  . . |
|
Last data update: 2014.03.03 |
Add a color legend to a phylo-rate plotDescriptionAdd a legend to a phylorate plot, with greater manual control. UsageaddBAMMlegend(x, direction, side, location = "topleft", nTicks = 2, shortFrac = 0.02, longFrac = 0.3, axisOffset = 0.002, cex.axis = 0.8, labelDist = 0.7, ...) Arguments
DetailsA number of predefined locations exist in this function to make
it easy to add a legend to a phylorate plot. Preset ValueInvisibly returns a list with the following components:
Author(s)Pascal Title See AlsoRequires an object created with Examples
data(whales, events.whales)
ephy <- getEventData(whales, events.whales, burnin = 0.25, nsamples = 300)
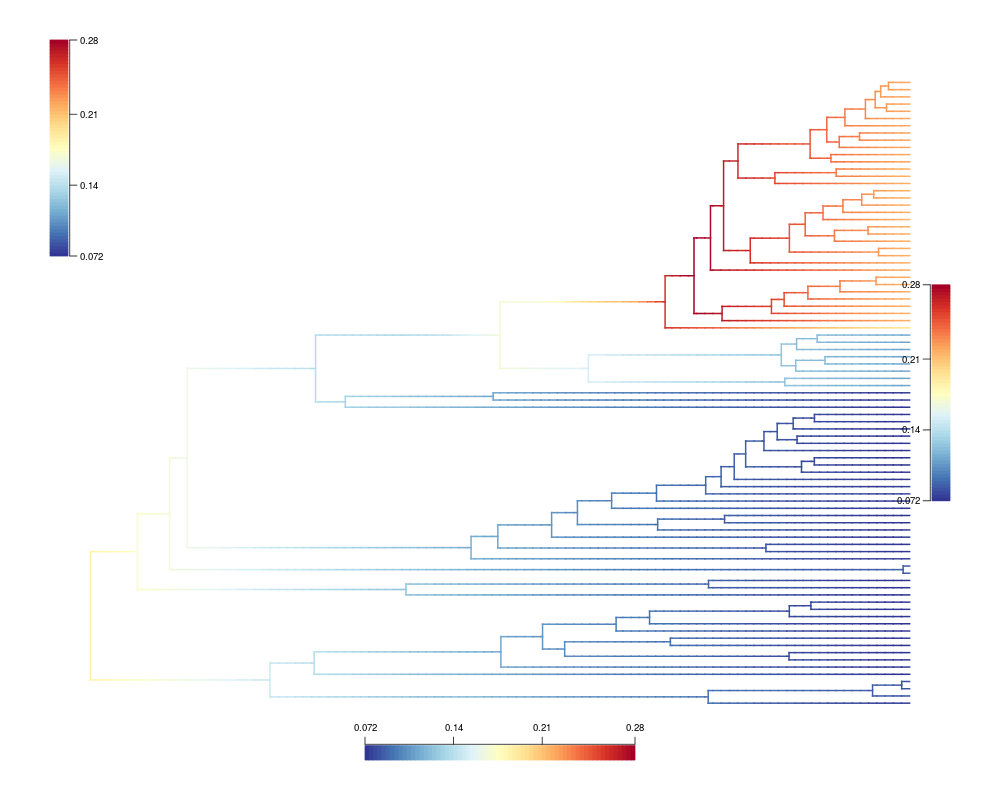
# plot phylorate with extra margin space
x <- plot(ephy, lwd = 2, mar = c(5,4,4,4))
# presets
addBAMMlegend(x, location = 'topleft')
addBAMMlegend(x, location = 'bottom')
addBAMMlegend(x, location = 'right')
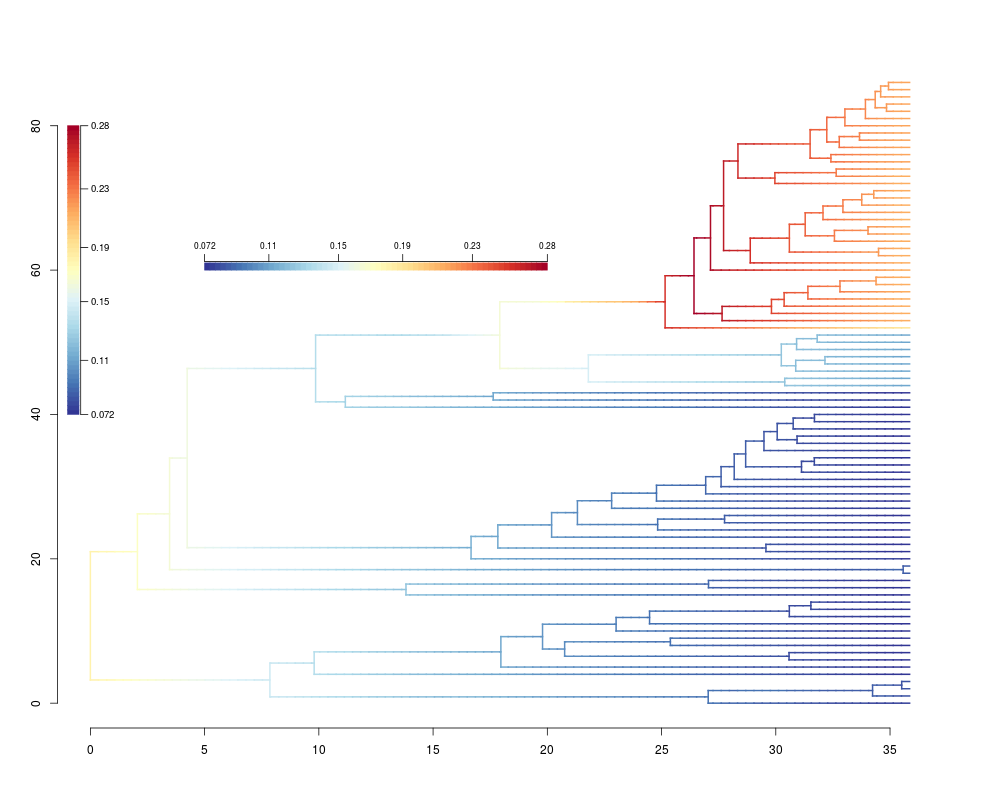
# fine-tune placement
x <- plot(ephy, lwd = 2, mar = c(5,4,4,4))
axis(1); axis(2)
addBAMMlegend(x, location = c(-1, -0.5, 40, 80), nTicks = 4)
addBAMMlegend(x, location = c(5, 20, 60, 61), nTicks = 4, side = 3,
cex.axis = 0.7)
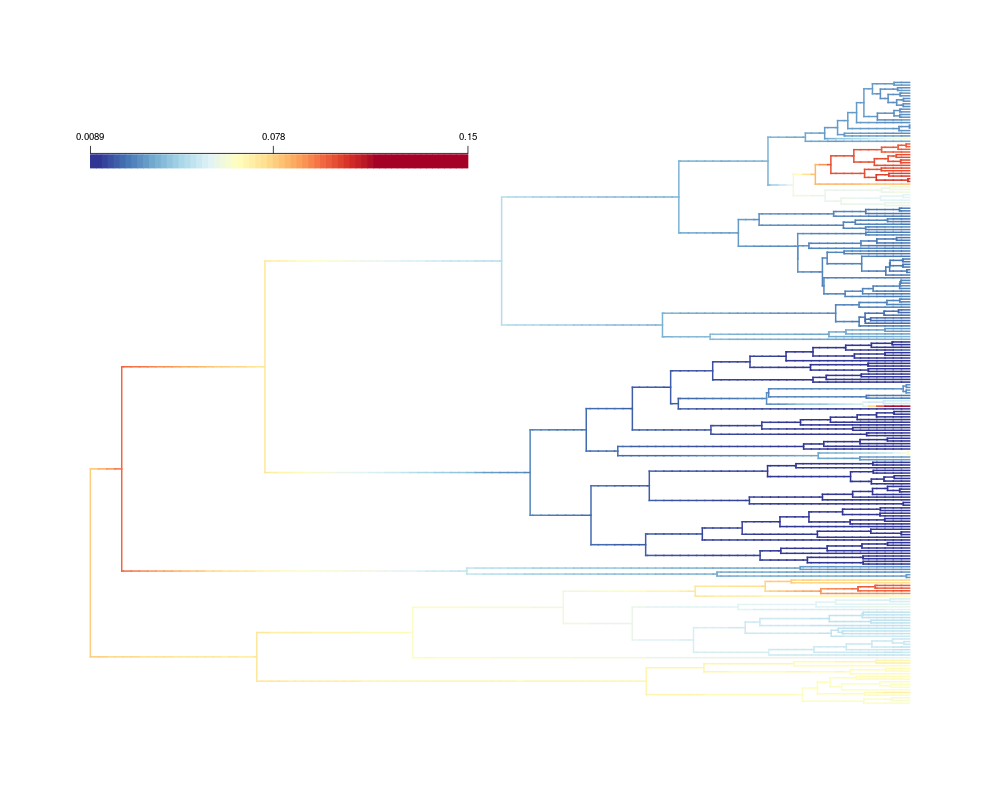
# addBAMMlegend also automatically detects the use of color.interval
data(primates, events.primates)
ephy <- getEventData(primates, events.primates, burnin=0.25,
nsamples = 300, type = 'trait')
x <- plot(ephy, breaksmethod = 'linear',
color.interval = c(NA, 0.12), lwd = 2)
addBAMMlegend(x, location = c(0, 30, 200, 205), nTicks = 1, side = 3)
Results
R version 3.3.1 (2016-06-21) -- "Bug in Your Hair"
Copyright (C) 2016 The R Foundation for Statistical Computing
Platform: x86_64-pc-linux-gnu (64-bit)

R is free software and comes with ABSOLUTELY NO WARRANTY.
You are welcome to redistribute it under certain conditions.
Type 'license()' or 'licence()' for distribution details.

R is a collaborative project with many contributors.
Type 'contributors()' for more information and
'citation()' on how to cite R or R packages in publications.

Type 'demo()' for some demos, 'help()' for on-line help, or
'help.start()' for an HTML browser interface to help.
Type 'q()' to quit R.

> library(BAMMtools)
Loading required package: ape
> png(filename="/home/ddbj/snapshot/RGM3/R_CC/result/BAMMtools/addBAMMlegend.Rd_%03d_medium.png", width=480, height=480)
> ### Name: addBAMMlegend
> ### Title: Add a color legend to a phylo-rate plot
> ### Aliases: addBAMMlegend
>
> ### ** Examples
>
> data(whales, events.whales)
> ephy <- getEventData(whales, events.whales, burnin = 0.25, nsamples = 300)
Processing event data from data.frame

Discarded as burnin: GENERATIONS <  2495000
Analyzing  300  samples from posterior

Setting recursive sequence on tree...

Done with recursive sequence

>
> # plot phylorate with extra margin space
> x <- plot(ephy, lwd = 2, mar = c(5,4,4,4))
> # presets
> addBAMMlegend(x, location = 'topleft')
> addBAMMlegend(x, location = 'bottom')
> addBAMMlegend(x, location = 'right')
>
> # fine-tune placement
> x <- plot(ephy, lwd = 2, mar = c(5,4,4,4))
> axis(1); axis(2)
> addBAMMlegend(x, location = c(-1, -0.5, 40, 80), nTicks = 4)
> addBAMMlegend(x, location = c(5, 20, 60, 61), nTicks = 4, side = 3,
+               cex.axis = 0.7)
>
> # addBAMMlegend also automatically detects the use of color.interval
> data(primates, events.primates)
> ephy <- getEventData(primates, events.primates, burnin=0.25,
+                      nsamples = 300, type = 'trait')
Processing event data from data.frame

Discarded as burnin: GENERATIONS <  4990000
Analyzing  300  samples from posterior

Setting recursive sequence on tree...

Done with recursive sequence

>
> x <- plot(ephy, breaksmethod = 'linear',
+           color.interval = c(NA, 0.12), lwd = 2)
> addBAMMlegend(x, location = c(0, 30, 200, 205), nTicks = 1, side = 3)
>
>
>
>
>
> dev.off()
null device
          1
>
|