Supported by Dr. Osamu Ogasawara and  . . |
|
Last data update: 2014.03.03 |
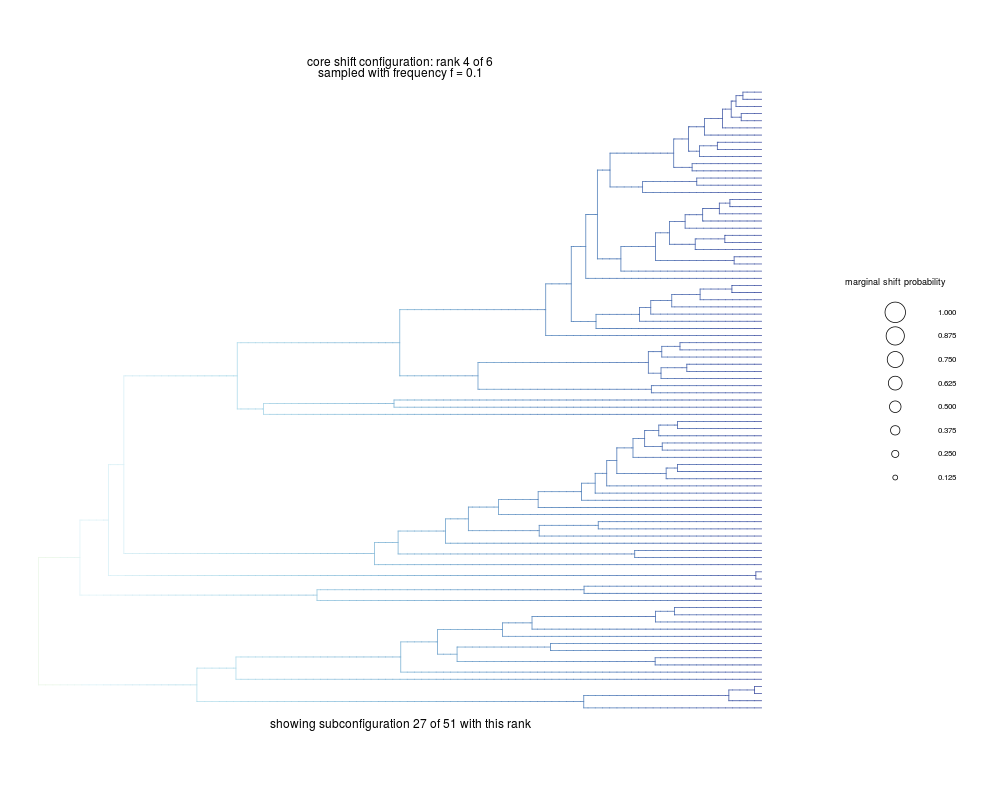
Plot distinct rate shift configurations on a phylogenyDescriptionPlots a random distinct rate shift configuration sampled by
Usage## S3 method for class 'bammshifts' plot(x, ephy, method = "phylogram", pal = "RdYlBu", rank = NULL, index = NULL, spex = "s", legend = TRUE, add.freq.text = TRUE, logcolor = FALSE, breaksmethod = "linear", color.interval = NULL, JenksSubset = 20000, ...) Arguments
DetailsA rate shift configuration is the set of nodes of the phylogeny
where a shift occurs in the macroevolutionary rate dynamic of
diversification or trait evolution. Each posterior sample is a
potentially distinct rate shift configuration. Different
configurations may imply different macroevolutionary scenarios. This
function helps visualize the different distinct rate shift
configurations sampled by A core shift configuration is defined by a set of nodes that have
shift probabilities that are substantially elevated relative to what
you expect under the prior alone. These core configurations are
inferred in Points are added to the branches subtending the nodes of each rate configuration. The size of the point is proportional to the marginal probability that a shift occurs on a specific branch. If the instantaneous rate at a shift's origin represents an initial increase above the ancestral instantaneous rate the point is red. If the instantaneous rate at a shift's origin represents an initial decrease below the ancestral instantaneous rate the point is blue. Author(s)Mike Grundler, Dan Rabosky ReferencesSee Also
Examples
data(whales, events.whales)

ed <- getEventData(whales, events.whales, burnin=0.25, nsamples=500)

sc <- distinctShiftConfigurations(ed, expectedNumberOfShifts = 1,
                                  threshold = 5)

plot(sc, ed)
Results
R version 3.3.1 (2016-06-21) -- "Bug in Your Hair"
Copyright (C) 2016 The R Foundation for Statistical Computing
Platform: x86_64-pc-linux-gnu (64-bit)

R is free software and comes with ABSOLUTELY NO WARRANTY.
You are welcome to redistribute it under certain conditions.
Type 'license()' or 'licence()' for distribution details.

R is a collaborative project with many contributors.
Type 'contributors()' for more information and
'citation()' on how to cite R or R packages in publications.

Type 'demo()' for some demos, 'help()' for on-line help, or
'help.start()' for an HTML browser interface to help.
Type 'q()' to quit R.

> library(BAMMtools)
Loading required package: ape
> png(filename="/home/ddbj/snapshot/RGM3/R_CC/result/BAMMtools/plot.bammshifts.Rd_%03d_medium.png", width=480, height=480)
> ### Name: plot.bammshifts
> ### Title: Plot distinct rate shift configurations on a phylogeny
> ### Aliases: plot.bammshifts
>
> ### ** Examples
>
> data(whales, events.whales)
>
> ed <- getEventData(whales, events.whales, burnin=0.25, nsamples=500)
Processing event data from data.frame

Discarded as burnin: GENERATIONS <  2495000
Analyzing  500  samples from posterior

Setting recursive sequence on tree...

Done with recursive sequence

>
> sc <- distinctShiftConfigurations(ed, expectedNumberOfShifts = 1,
+                                   threshold = 5)
>
> plot(sc, ed)
>
>
>
>
>
> dev.off()
null device
          1
>
|