Supported by Dr. Osamu Ogasawara and  . . |
|
Last data update: 2014.03.03 |
Histogram of
|
phylorates |
A saved |
plotBrks |
Boolean, should breaks be plotted over the histogram. |
xlab |
x-axis label. |
ylab |
y-axis label. |
lwd |
Line width for breaks. |
lty |
Line style for breaks. |
brksCol |
Color of breaks lines. |
... |
Additional arguments passed on to |
Details
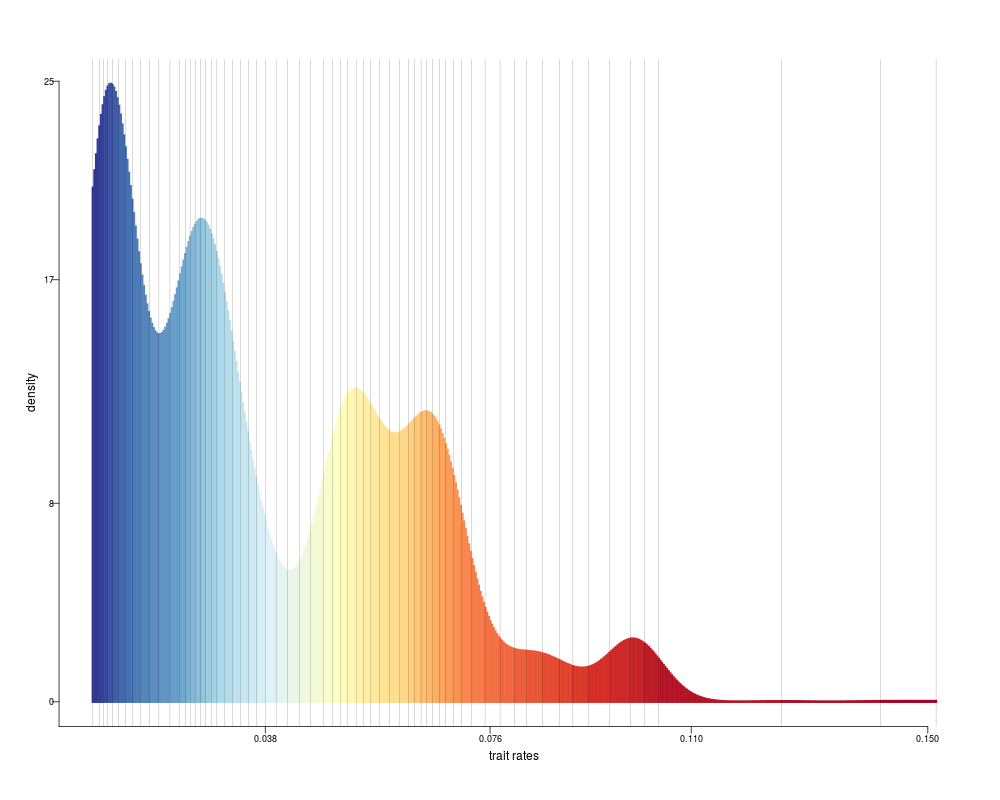
With this function, a histogram is plotted that shows the
frequency of rates present in the dataset. The color scheme plotted
is taken from the saved plot.bammdata object that is the main
input. Therefore, the mapping of colors to rates in the histogram
corresponds exactly to what is plotted in the phylorate plot. If
plotBrks = TRUE, then the color breaks used for the phylorates
plot are shown.
This function can be a useful tool for exploring different
plot.bammdata options. Please see
http://bamm-project.org/colorbreaks.html on the bamm-project
website for more information on the utility of this function.
Author(s)
Pascal Title
References
See Also
plot.bammdata
Examples
data(primates, events.primates)
ed <- getEventData(primates, events.primates, burnin=0.25, nsamples=500,
                   type = 'trait')

# create phylorate plot with the jenks breaks method to generate output
phylorates <- plot(ed, breaksmethod='jenks', show = FALSE)

ratesHistogram(phylorates, plotBrks = TRUE, xlab = 'trait rates')
Results
R version 3.3.1 (2016-06-21) -- "Bug in Your Hair"
Copyright (C) 2016 The R Foundation for Statistical Computing
Platform: x86_64-pc-linux-gnu (64-bit)

R is free software and comes with ABSOLUTELY NO WARRANTY.
You are welcome to redistribute it under certain conditions.
Type 'license()' or 'licence()' for distribution details.

R is a collaborative project with many contributors.
Type 'contributors()' for more information and
'citation()' on how to cite R or R packages in publications.

Type 'demo()' for some demos, 'help()' for on-line help, or
'help.start()' for an HTML browser interface to help.
Type 'q()' to quit R.

> library(BAMMtools)
Loading required package: ape
> png(filename="/home/ddbj/snapshot/RGM3/R_CC/result/BAMMtools/ratesHistogram.Rd_%03d_medium.png", width=480, height=480)
> ### Name: ratesHistogram
> ### Title: Histogram of 'BAMM' rate frequencies
> ### Aliases: ratesHistogram
>
> ### ** Examples
>
> data(primates, events.primates)
> ed <- getEventData(primates, events.primates, burnin=0.25, nsamples=500,
+                    type = 'trait')
Processing event data from data.frame

Discarded as burnin: GENERATIONS <  4990000
Analyzing  500  samples from posterior

Setting recursive sequence on tree...

Done with recursive sequence

>
> # create phylorate plot with the jenks breaks method to generate output
> phylorates <- plot(ed, breaksmethod='jenks', show = FALSE)
>
> ratesHistogram(phylorates, plotBrks = TRUE, xlab = 'trait rates')
>
>
>
>
>
> dev.off()
null device
          1
>
|