R: Plotting Bayesian Network Discovery using a Hybrid Fast...
plot.Networks.Fast
R Documentation
Plotting Bayesian Network Discovery using a Hybrid Fast Algorithm
Description
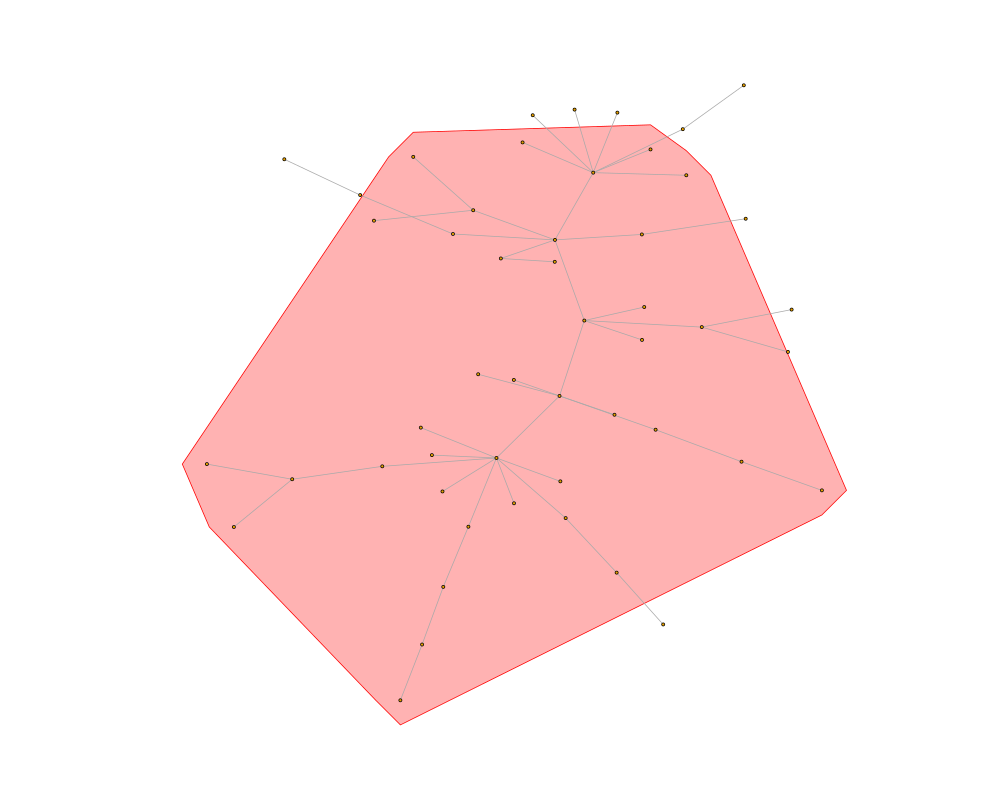
plot method for class "Networks.Fast"
Usage
## S3 method for class 'Networks.Fast'
plot(x, ...)
Arguments
x
An object of class "Networks.Fast" resulting of a call to Networks.Fast.
...
other arguments
See Also
Networks.Fast.
Examples
library(igraph)
####Gene Network discovery
##Generating Scale free Gene Network
library(igraph)
g <- barabasi.game(50, power=1, zero.appeal=1.5,directed = FALSE)
net=as(get.adjacency(g,attr=NULL),"matrix")
##Random assign selected genes and make the signal intension as gaussian mixture
newz=rep(c(1,0,0,1,0),10)
Simnorm=function(n){
weight = c(0.4, 0.6)
mu = c(8,6)
sigma = c(1,0.5)
z = sample(c(1,2),size=n, prob=weight,replace=TRUE)
r = rnorm(n,mean=mu[z],sd=sigma[z])
return(r)
}
testcov<-0
for(i in 1:50){
 if(newz[i]==0){
   testcov[i]<-rnorm(1,mean=0,sd=1)
 }else{
  testcov[i]<-Simnorm(1)
 }
}
pvalue=pnorm(-testcov)
total1=Networks.Fast(pvalue,net,iter=5,nburns=2,
v=20,algorithms="DPM",DPparallel=FALSE,
piall=c(0.8, 0.85, 0.9, 0.95),rhoall=c(1, 2, 5, 10, 15)
)

######Plotting the object of class "Networks.Fast"
plot(total1)
Results
R version 3.3.1 (2016-06-21) -- "Bug in Your Hair"
Copyright (C) 2016 The R Foundation for Statistical Computing
Platform: x86_64-pc-linux-gnu (64-bit)

R is free software and comes with ABSOLUTELY NO WARRANTY.
You are welcome to redistribute it under certain conditions.
Type 'license()' or 'licence()' for distribution details.

R is a collaborative project with many contributors.
Type 'contributors()' for more information and
'citation()' on how to cite R or R packages in publications.

Type 'demo()' for some demos, 'help()' for on-line help, or
'help.start()' for an HTML browser interface to help.
Type 'q()' to quit R.

> library(BANFF)
Loading required package: foreach
Loading required package: doParallel
Loading required package: iterators
Loading required package: parallel
> png(filename="/home/ddbj/snapshot/RGM3/R_CC/result/BANFF/plot.Networks.Fast.Rd_%03d_medium.png", width=480, height=480)
> ### Name: plot.Networks.Fast
> ### Title: Plotting Bayesian Network Discovery using a Hybrid Fast
> ###   Algorithm
> ### Aliases: plot.Networks.Fast
>
> ### ** Examples
>
> library(igraph)

Attaching package: 'igraph'

The following objects are masked from 'package:stats':

    decompose, spectrum

The following object is masked from 'package:base':

    union

> ####Gene Network discovery
> ##Generating Scale free Gene Network
> library(igraph)
> g <- barabasi.game(50, power=1, zero.appeal=1.5,directed = FALSE)
> net=as(get.adjacency(g,attr=NULL),"matrix")
> ##Random assign selected genes and make the signal intension as gaussian mixture
> newz=rep(c(1,0,0,1,0),10)
> Simnorm=function(n){
+ weight = c(0.4, 0.6)
+ mu = c(8,6)
+ sigma = c(1,0.5)
+ z = sample(c(1,2),size=n, prob=weight,replace=TRUE)
+ r = rnorm(n,mean=mu[z],sd=sigma[z])
+ return(r)
+ }
> testcov<-0
> for(i in 1:50){
+  if(newz[i]==0){
+    testcov[i]<-rnorm(1,mean=0,sd=1)
+  }else{
+   testcov[i]<-Simnorm(1)
+  }
+ }
> pvalue=pnorm(-testcov)
> total1=Networks.Fast(pvalue,net,iter=5,nburns=2,
+ v=20,algorithms="DPM",DPparallel=FALSE,
+ piall=c(0.8, 0.85, 0.9, 0.95),rhoall=c(1, 2, 5, 10, 15)
+ )
[1] "NOW_Transferring p-values to testing statistics"
[1] "NOW_Getting initials by Kmeans"
[1] "NOW_Generating_Zi for likelihood comparison"
[1] "NOW_Comparing the likelihood to select the best set"
[1] "Iteration Begins~"


>
> ######Plotting the object of class "Networks.Fast"
> plot(total1)
>
>
>
>
>
> dev.off()
null device
          1
>
 .
.