Supported by Dr. Osamu Ogasawara and  . . |
|
Last data update: 2014.03.03 |
Business Cycle Dating and Plotting ToolsDescriptionThis package implements the Harding and Pagan algorithm that creates a quarterly dating from a univariate time series. Procedures for printing and plotting appropriate graphs are provided. Also the dating for business cycles of the economy of Iran (by MBRI, CBI) is provided. Details
Author(s)Majid Einian,m.einian@mbri.ac.ir, See Also
Examples
library(BCDating)
data("Iran.non.Oil.GDP.Cycle")
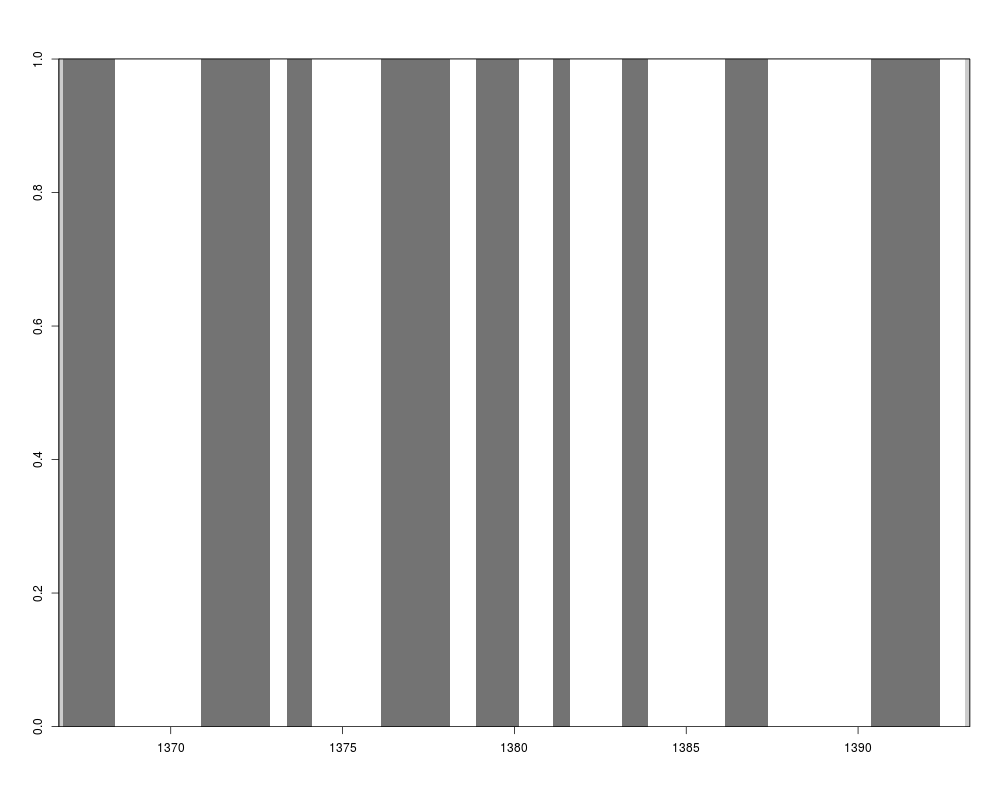
dat <- BBQ(Iran.non.Oil.GDP.Cycle, name="Dating Business Cycles of Iran")
show(dat)
summary(dat)
plot(dat)
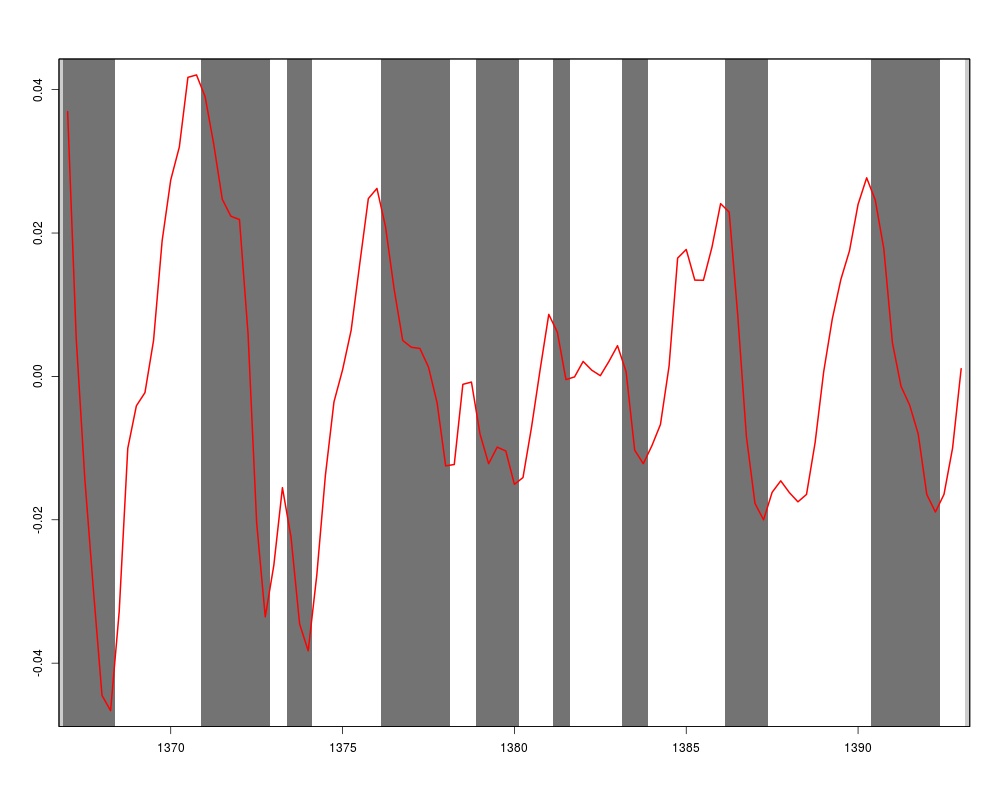
plot(dat,Iran.non.Oil.GDP.Cycle)
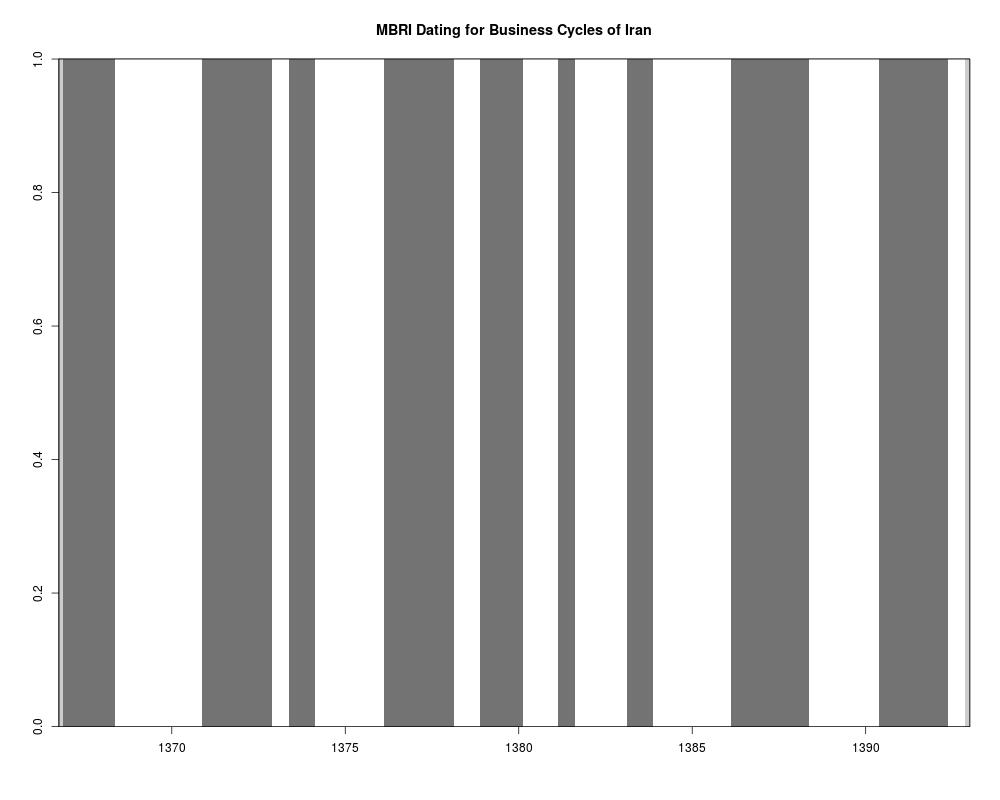
data("MBRI.Iran.Dating")
plot(MBRI.Iran.Dating)
Results
R version 3.3.1 (2016-06-21) -- "Bug in Your Hair"
Copyright (C) 2016 The R Foundation for Statistical Computing
Platform: x86_64-pc-linux-gnu (64-bit)

R is free software and comes with ABSOLUTELY NO WARRANTY.
You are welcome to redistribute it under certain conditions.
Type 'license()' or 'licence()' for distribution details.

R is a collaborative project with many contributors.
Type 'contributors()' for more information and
'citation()' on how to cite R or R packages in publications.

Type 'demo()' for some demos, 'help()' for on-line help, or
'help.start()' for an HTML browser interface to help.
Type 'q()' to quit R.

> library(BCDating)
> png(filename="/home/ddbj/snapshot/RGM3/R_CC/result/BCDating/BCDating-package.Rd_%03d_medium.png", width=480, height=480)
> ### Name: BCDating-package
> ### Title: Business Cycle Dating and Plotting Tools
> ### Aliases: BCDating-package BCDating
> ### Keywords: package
>
> ### ** Examples
>
> library(BCDating)
> data("Iran.non.Oil.GDP.Cycle")
> dat <- BBQ(Iran.non.Oil.GDP.Cycle, name="Dating Business Cycles of Iran")
> show(dat)
   Peaks Troughs Duration
1   <NA>  1368Q2     <NA>
2 1370Q4  1372Q4        8
3 1373Q2  1374Q1        3
4 1376Q1  1378Q1        8
5 1378Q4  1380Q1        5
6 1381Q1  1381Q3        2
7 1383Q1  1383Q4        3
8 1386Q1  1387Q2        5
9 1390Q2  1392Q2        8
> summary(dat)
       Phase ]Start  ;End] Duration LevStart LevEnd Amplitude
1  Recession   <NA> 1368Q2       NA       NA      0        NA
2  Expansion 1368Q2 1370Q4       10        0      0       0.1
3  Recession 1370Q4 1372Q4        8        0      0       0.1
4  Expansion 1372Q4 1373Q2        2        0      0       0.0
5  Recession 1373Q2 1374Q1        3        0      0       0.0
6  Expansion 1374Q1 1376Q1        8        0      0       0.1
7  Recession 1376Q1 1378Q1        8        0      0       0.0
8  Expansion 1378Q1 1378Q4        3        0      0       0.0
9  Recession 1378Q4 1380Q1        5        0      0       0.0
10 Expansion 1380Q1 1381Q1        4        0      0       0.0
11 Recession 1381Q1 1381Q3        2        0      0       0.0
12 Expansion 1381Q3 1383Q1        6        0      0       0.0
13 Recession 1383Q1 1383Q4        3        0      0       0.0
14 Expansion 1383Q4 1386Q1        9        0      0       0.0
15 Recession 1386Q1 1387Q2        5        0      0       0.0
16 Expansion 1387Q2 1390Q2       12        0      0       0.0
17 Recession 1390Q2 1392Q2        8        0      0       0.0
18 Expansion 1392Q2   <NA>       NA        0     NA        NA

          Amplitude Duration
Exp=]T;P]         0      6.8
Rec=]P;T]         0      5.2
> plot(dat)
> plot(dat,Iran.non.Oil.GDP.Cycle)
>
> data("MBRI.Iran.Dating")
> plot(MBRI.Iran.Dating)
>
>
>
>
>
> dev.off()
null device
          1
>
|
Created & Maintained by Osamu Ogasawara (osamu.ogasawara@gmail.com) and 