Supported by Dr. Osamu Ogasawara and  . . |
|
Last data update: 2014.03.03 |
BEANSPDescriptionPackage BEANSP computes age specific nest survival rates based on a Bayesian hierarchical model. Details
The package BEANSP can be applied on either one of the two simple data formats, interval format and date format. For more details of data format, see example 1 and example 2 instruction. For either data format, first use the function "nestconv" to convert a data to the standard format including (ul,ur,zl,zr,y); then apply the function "nestsr" to generate the nest survival summary. Author(s)Chong He, Yiqun Yang, Jing Cao Maintainer:Yiqun Yang <yyry2@mail.missouri.edu> ReferencesCao, J., He, C., Suedkamp Wells, K.M., Millspaugh, J.J., and Ryan, M.R. (2009). Modeling age and nest-specific survival using a hierarchical Bayesian approach. Biometrics, 65, 1052-1062. He, C.,Yang, Y.. User Instruction for Program BEANSP. Examples## Data Input with Date Format ## For the details of all variables in the date format, refer to the "example 2" part. library(BEANSP) data(example2) data<-example2 jj<-as.integer(20) nx<-as.integer(2) nn<-as.integer(233) x1<-example2[1:nn,6] x2<-example2[1:nn,7] x<-cbind(as.double(x1),as.double(x2)) temp<-nestconv(1,nn,jj,data) ## Data Input with Interval Format ## For the details of all variables in the interval format, refer to the "example 1" part. library(BEANSP) data(example1) data<-example1 jj<-as.integer(19) nx<-as.integer(2) nn<-as.integer(217) x1<-example1[1:nn,7] x2<-example1[1:nn,8] x<-cbind(as.double(x1),as.double(x2)) temp<-nestconv(0,nn,jj,data) ## After converting data to the standard format (ul,ur,zl,zr,y) ## set initial values (a,b,sigma,day,enc,covar) and burnin number (n0,ntotal) ul<-as.integer(temp[,2]) ur<-as.integer(temp[,3]) zl<-as.integer(temp[,4]) zr<-as.integer(temp[,5]) y<-as.integer(temp[,6]) a<-as.double(rep(2.0,2)) b<-as.double(rep(1.0,2)) sigma<-as.double(rep(1.0,2)) day<-as.double(rep(0.0,jj)) enc<-as.double(rep(0.0,jj-1)) covar<-as.double(rep(0.0,nx)) n0<-as.integer(10) ntotal<-as.integer(110) out<-nestsr(jj,nx,nn,ul,ur,zl,zr,x,y,a,b,sigma,day,enc,covar,n0,ntotal) ## After applying the function "nestsr" ## some trace plots or survival plots can be created using the folloing functions. plot.asr(out$asr,out$jj) plot.casr(out$casr,out$jj) plot.del(out$del,out$jj) plot.q(out$q,1,out$jj) # 1 is the first nest age-specific outcome rates plot.sr(out$sr,1,out$jj)# 1 is the first nest age-specific survival rates i1=1 i2=ntotal plot.trace1(out$trace1,i1,i2,1) # trace plot for E_1 plot.trace2(out$trace2,i1,i2,1) # trace plot for A_1 plot.trace3(out$trace3,i1,i2,1) # trace plot for covar_1 plot.trace4(out$trace4,i1,i2,1) # trace plot for sigma_1 Results
R version 3.3.1 (2016-06-21) -- "Bug in Your Hair"
Copyright (C) 2016 The R Foundation for Statistical Computing
Platform: x86_64-pc-linux-gnu (64-bit)
R is free software and comes with ABSOLUTELY NO WARRANTY.
You are welcome to redistribute it under certain conditions.
Type 'license()' or 'licence()' for distribution details.
R is a collaborative project with many contributors.
Type 'contributors()' for more information and
'citation()' on how to cite R or R packages in publications.
Type 'demo()' for some demos, 'help()' for on-line help, or
'help.start()' for an HTML browser interface to help.
Type 'q()' to quit R.
> library(BEANSP)
> png(filename="/home/ddbj/snapshot/RGM3/R_CC/result/BEANSP/BEANSP-package.Rd_%03d_medium.png", width=480, height=480)
> ### Name: BEANSP-package
> ### Title: BEANSP
> ### Aliases: BEANSP-package BEANSP
> ### Keywords: package
>
> ### ** Examples
>
> ## Data Input with Date Format
> ## For the details of all variables in the date format, refer to the "example 2" part.
> library(BEANSP)
> data(example2)
> data<-example2
> jj<-as.integer(20)
> nx<-as.integer(2)
> nn<-as.integer(233)
> x1<-example2[1:nn,6]
> x2<-example2[1:nn,7]
> x<-cbind(as.double(x1),as.double(x2))
> temp<-nestconv(1,nn,jj,data)
>
> ## Data Input with Interval Format
> ## For the details of all variables in the interval format, refer to the "example 1" part.
> library(BEANSP)
> data(example1)
> data<-example1
> jj<-as.integer(19)
> nx<-as.integer(2)
> nn<-as.integer(217)
> x1<-example1[1:nn,7]
> x2<-example1[1:nn,8]
> x<-cbind(as.double(x1),as.double(x2))
> temp<-nestconv(0,nn,jj,data)
>
>
> ## After converting data to the standard format (ul,ur,zl,zr,y)
> ## set initial values (a,b,sigma,day,enc,covar) and burnin number (n0,ntotal)
> ul<-as.integer(temp[,2])
> ur<-as.integer(temp[,3])
> zl<-as.integer(temp[,4])
> zr<-as.integer(temp[,5])
> y<-as.integer(temp[,6])
>
> a<-as.double(rep(2.0,2))
> b<-as.double(rep(1.0,2))
> sigma<-as.double(rep(1.0,2))
> day<-as.double(rep(0.0,jj))
> enc<-as.double(rep(0.0,jj-1))
> covar<-as.double(rep(0.0,nx))
> n0<-as.integer(10)
> ntotal<-as.integer(110)
> out<-nestsr(jj,nx,nn,ul,ur,zl,zr,x,y,a,b,sigma,day,enc,covar,n0,ntotal)
>
> ## After applying the function "nestsr"
> ## some trace plots or survival plots can be created using the folloing functions.
>
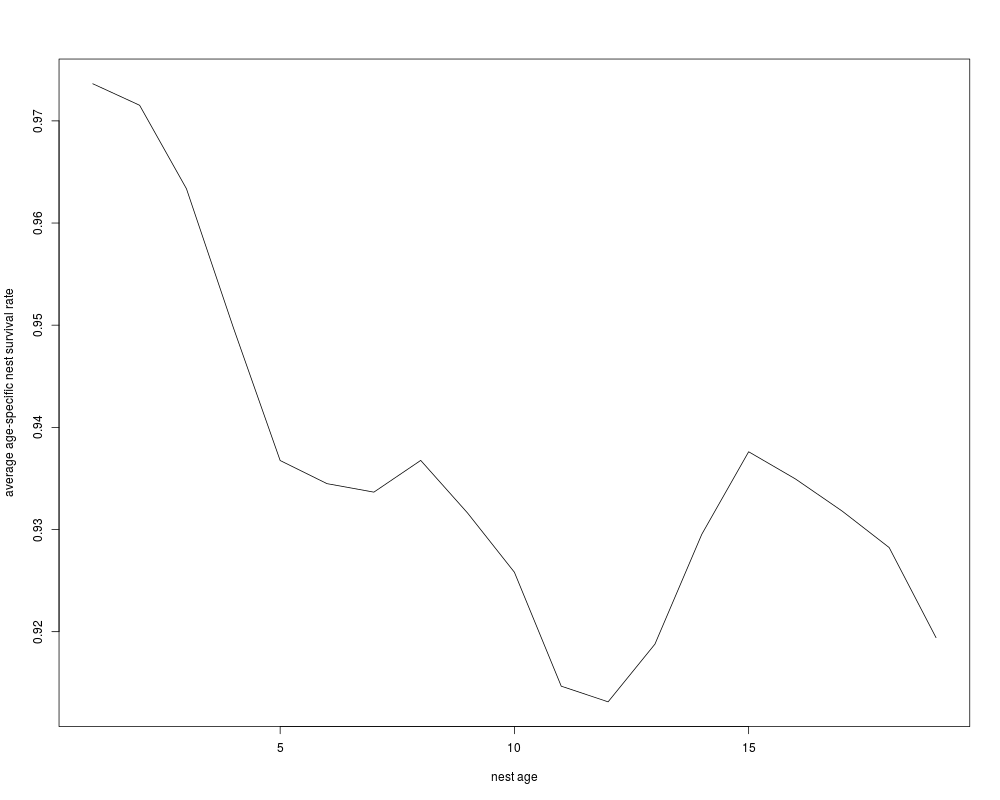
> plot.asr(out$asr,out$jj)
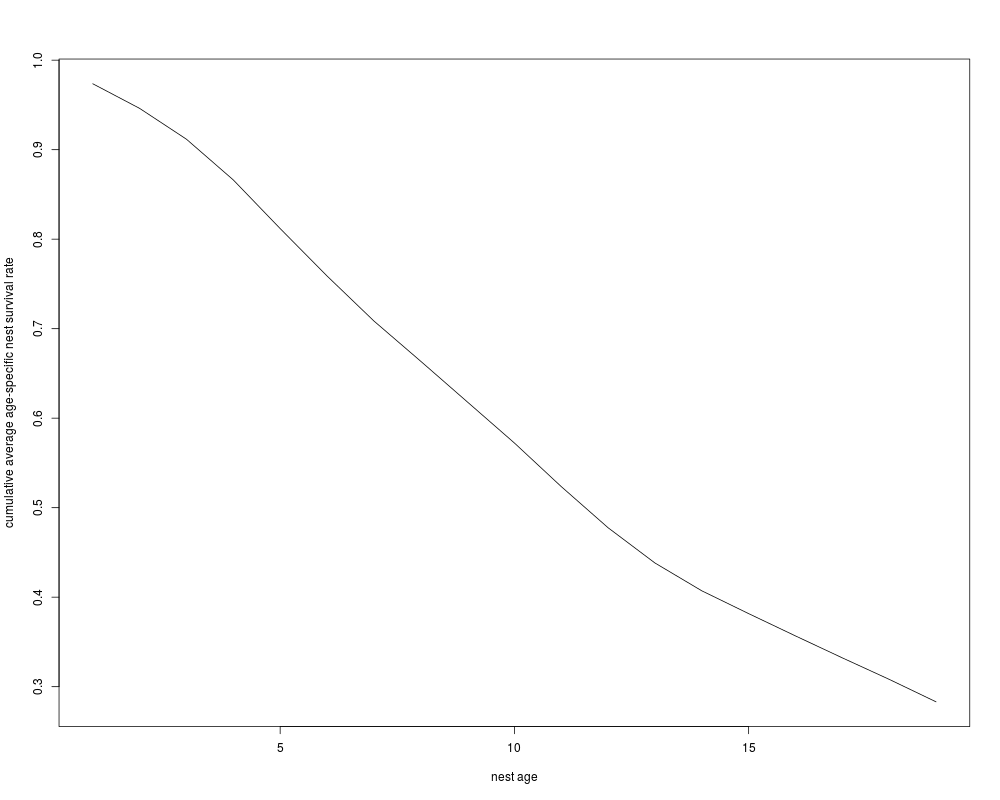
> plot.casr(out$casr,out$jj)
> plot.del(out$del,out$jj)
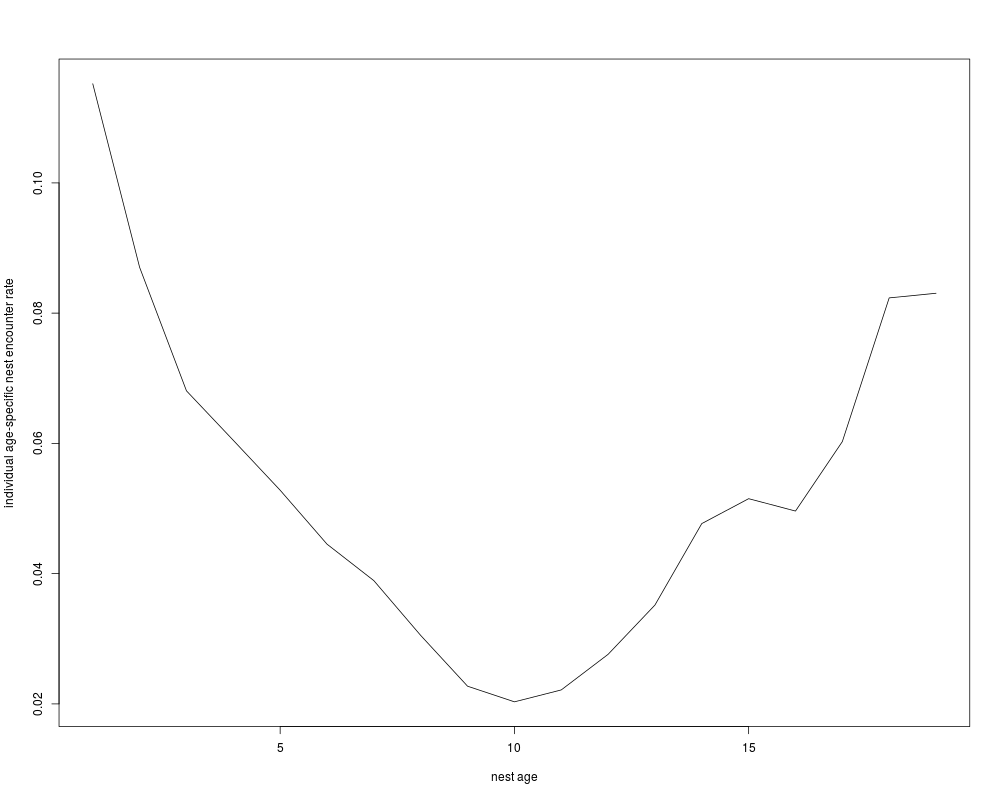
> plot.q(out$q,1,out$jj) # 1 is the first nest age-specific outcome rates
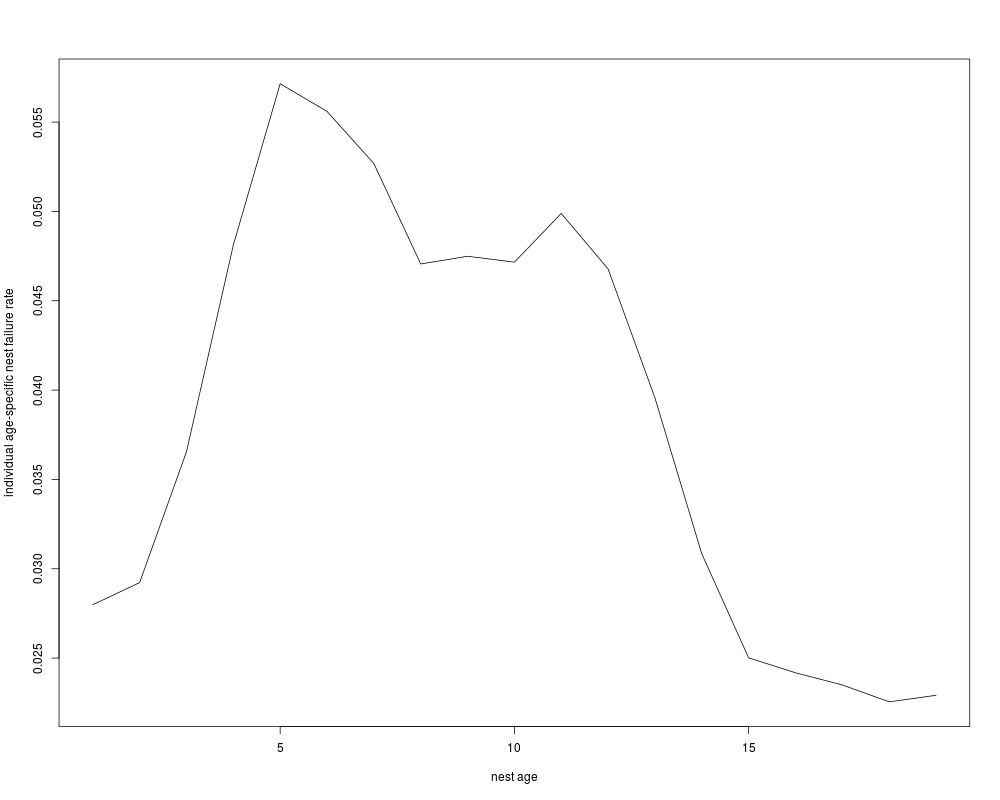
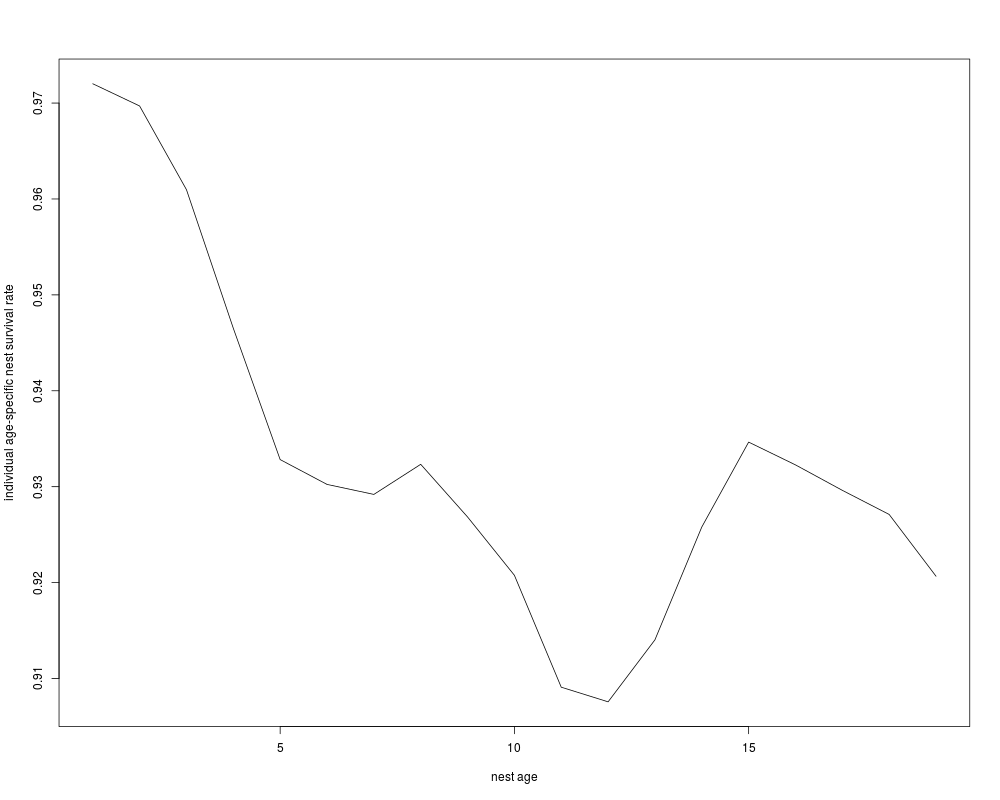
> plot.sr(out$sr,1,out$jj)# 1 is the first nest age-specific survival rates
> i1=1
> i2=ntotal
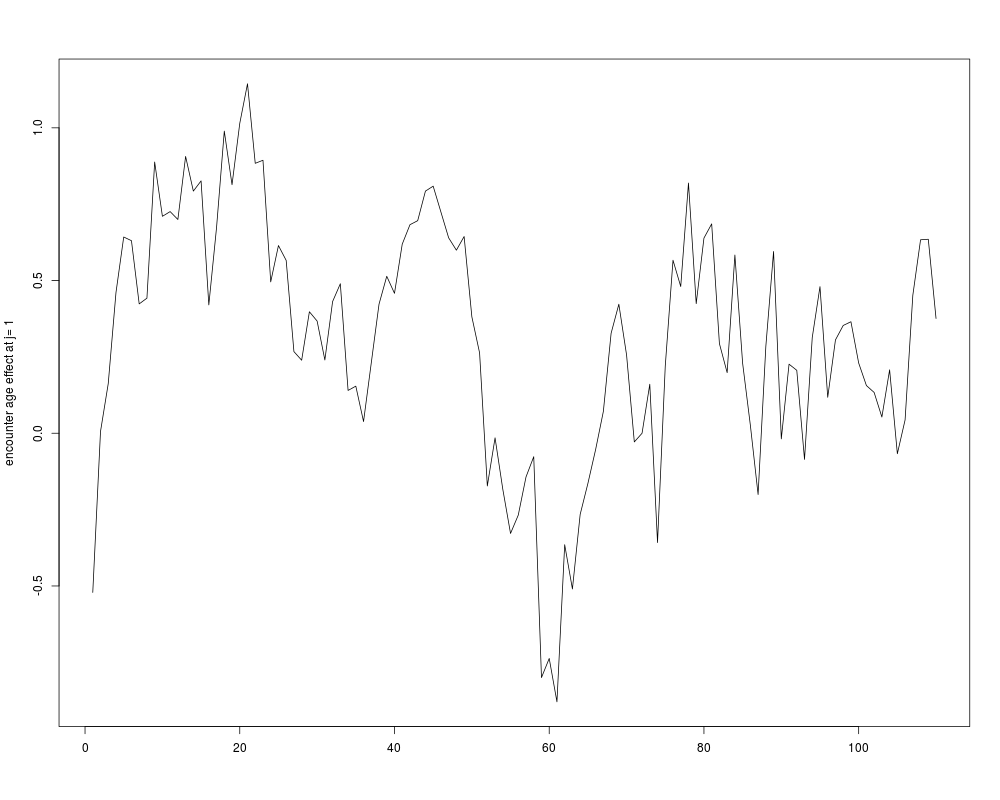
> plot.trace1(out$trace1,i1,i2,1) # trace plot for E_1
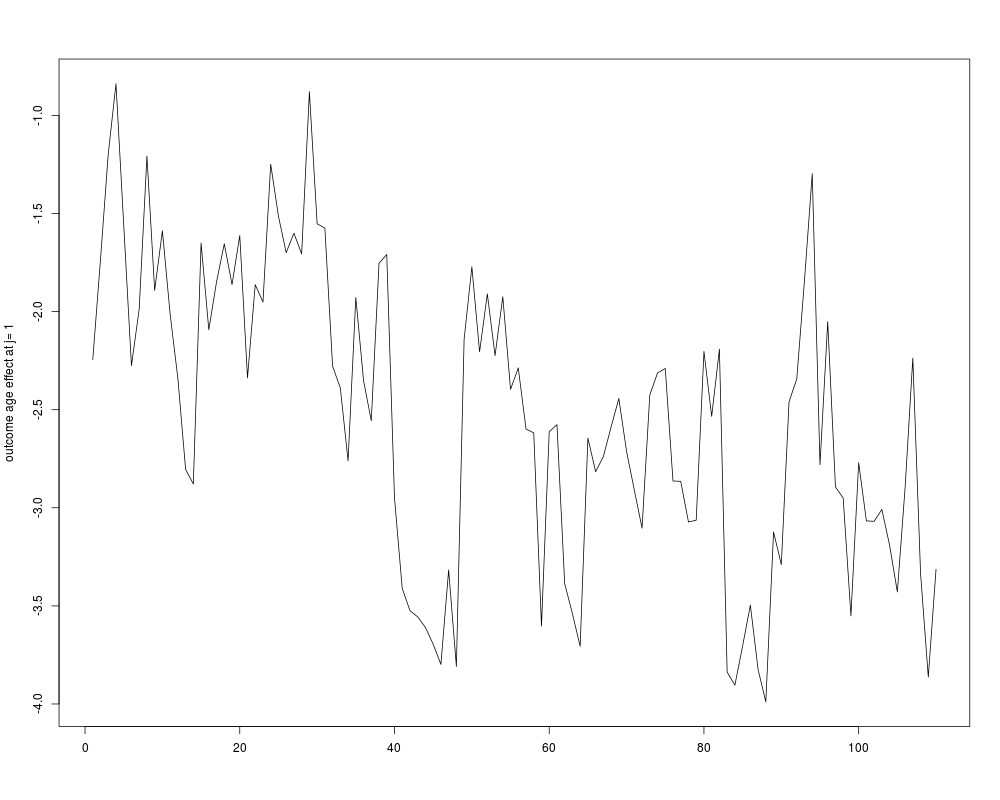
> plot.trace2(out$trace2,i1,i2,1) # trace plot for A_1
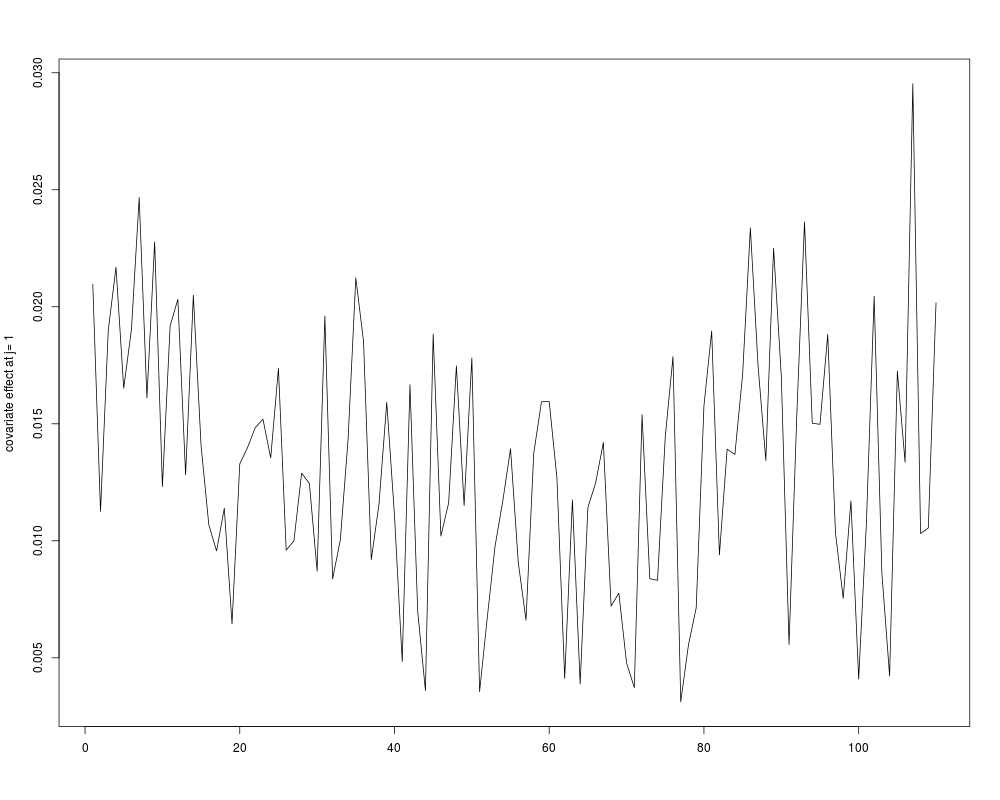
> plot.trace3(out$trace3,i1,i2,1) # trace plot for covar_1
> plot.trace4(out$trace4,i1,i2,1) # trace plot for sigma_1
>
>
>
>
>
>
> dev.off()
null device
1
>
|