This function parameterizes the decay in covariance of transformed allele frequencies
between sampled populations/individuals over their pairwise geographic and ecological
distance.
This parameter controls the variance when pairwise distance is zero. It is the
variance of the population-specific transformed allelic deviate (theta) when pairwise
distances are zero (i.e. when D_{i,j} + E_{i,j} = 0).
aD
This parameter gives the effect size of geographic distance (D_{i,j}).
aE
This parameter gives the effect size(s) of ecological distance(s) (E_{i,j}).
a2
This parameter controls the shape of the decay in covariance with distance.
GeoDist
Pairwise geographic distance (D_{i,j}). This may be Euclidean, or, if the
geographic scale of sampling merits it, great-circle distance.
EcoDist
Pairwise ecological distance(s) (E_{i,j}), which may be continuous (e.g. -
difference in elevation) or binary (same or opposite side of some hypothesized
barrier to gene flow).
delta
This gives the size of the "delta shift" on the off-diagonal elements of the
parametric covariance matrix, used to ensure its positive-definiteness (even, for
example, when there are separate populations sampled at the same
geographic/ecological coordinates). This value must be large enough that the
covariance matrix is positive-definite, but, if possible, should be smaller than the
smallest off-diagonal distance elements, lest it have an undue impact on inference.
If the user is concerned that the delta shift is too large relative to the pairwise
distance elements in D and E, she should run subsequent analyses, varying the size of
delta, to see if it has an impact on model inference.
Author(s)
Gideon Bradburd
Examples
#With the HGDP dataset
data(HGDP.bedassle.data)
#Draw random values of the {alpha} parameters from their priors
alpha0 <- rgamma(1,shape=1,rate=1)
alphaD <- rexp(1,rate=1)
alphaE <- matrix(rexp(1,rate=1),nrow=1,ncol=1)
alpha2 <- runif(1,0.1,2)
#Parameterize the covariance function using the HGDP dataset distances (Geo and Eco)
example.covariance <- Covariance(a0 = alpha0,aD = alphaD,aE = alphaE,a2 = alpha2,
GeoDist = HGDP.bedassle.data$GeoDistance,
EcoDist = list(HGDP.bedassle.data$EcoDistance),
delta = 0.001)
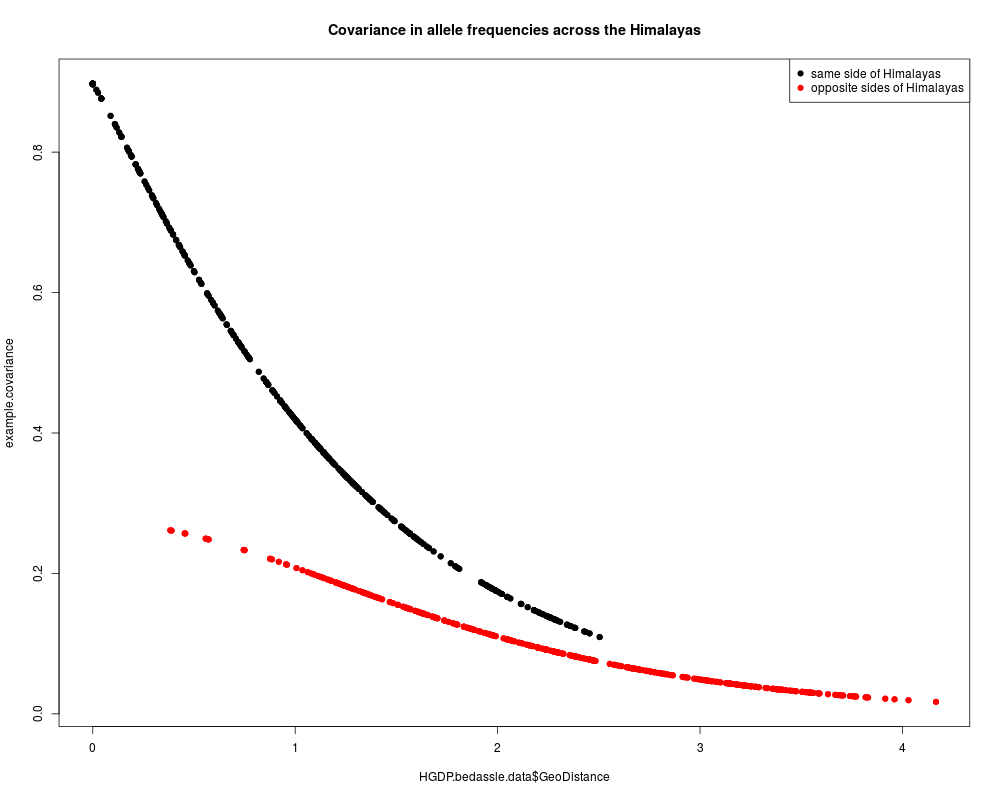
#Plot the example covariance against geographic distance
plot(HGDP.bedassle.data$GeoDistance,
example.covariance,
pch=19,col=HGDP.bedassle.data$EcoDistance+1,
main="Covariance in allele frequencies across the Himalayas")
legend(x="topright",pch=19,col=c(1,2),
legend=c("same side of Himalayas",
"opposite sides of Himalayas"))
Results
R version 3.3.1 (2016-06-21) -- "Bug in Your Hair"
Copyright (C) 2016 The R Foundation for Statistical Computing
Platform: x86_64-pc-linux-gnu (64-bit)

R is free software and comes with ABSOLUTELY NO WARRANTY.
You are welcome to redistribute it under certain conditions.
Type 'license()' or 'licence()' for distribution details.

R is a collaborative project with many contributors.
Type 'contributors()' for more information and
'citation()' on how to cite R or R packages in publications.

Type 'demo()' for some demos, 'help()' for on-line help, or
'help.start()' for an HTML browser interface to help.
Type 'q()' to quit R.

> library(BEDASSLE)
> png(filename="/home/ddbj/snapshot/RGM3/R_CC/result/BEDASSLE/Covariance.Rd_%03d_medium.png", width=480, height=480)
> ### Name: Covariance
> ### Title: The parametric covariance matrix
> ### Aliases: Covariance
>
> ### ** Examples
>
> #With the HGDP dataset
> 	data(HGDP.bedassle.data)
>
> #Draw random values of the {alpha} parameters from their priors
> 	alpha0 <- rgamma(1,shape=1,rate=1)
> 	alphaD <- rexp(1,rate=1)
> 	alphaE <- matrix(rexp(1,rate=1),nrow=1,ncol=1)
> 	alpha2 <- runif(1,0.1,2)
>
> #Parameterize the covariance function using the HGDP dataset distances (Geo and Eco)
> 	example.covariance <- Covariance(a0 = alpha0,aD = alphaD,aE = alphaE,a2 = alpha2,
+ 				GeoDist = HGDP.bedassle.data$GeoDistance,
+ 				EcoDist = list(HGDP.bedassle.data$EcoDistance),
+ 				delta = 0.001)
>
> #Plot the example covariance against geographic distance
> 	plot(HGDP.bedassle.data$GeoDistance,
+ 		example.covariance,
+ 		pch=19,col=HGDP.bedassle.data$EcoDistance+1,
+ 		main="Covariance in allele frequencies across the Himalayas")
> 			legend(x="topright",pch=19,col=c(1,2),
+ 				legend=c("same side of Himalayas",
+ 							"opposite sides of Himalayas"))
>
>
>
>
>
> dev.off()
null device
          1
>
 .
.